
Visual explain
- PostgreSQL
- MySQL
- MariaDB
Visual explain shows how the server runs one statement, as a tree of steps with their cost and row counts. Explain shows the plan the server estimates without running the statement. Explain Analyze runs it and measures each step, so you see actual rows and time next to the estimates and can find the step that takes longest.
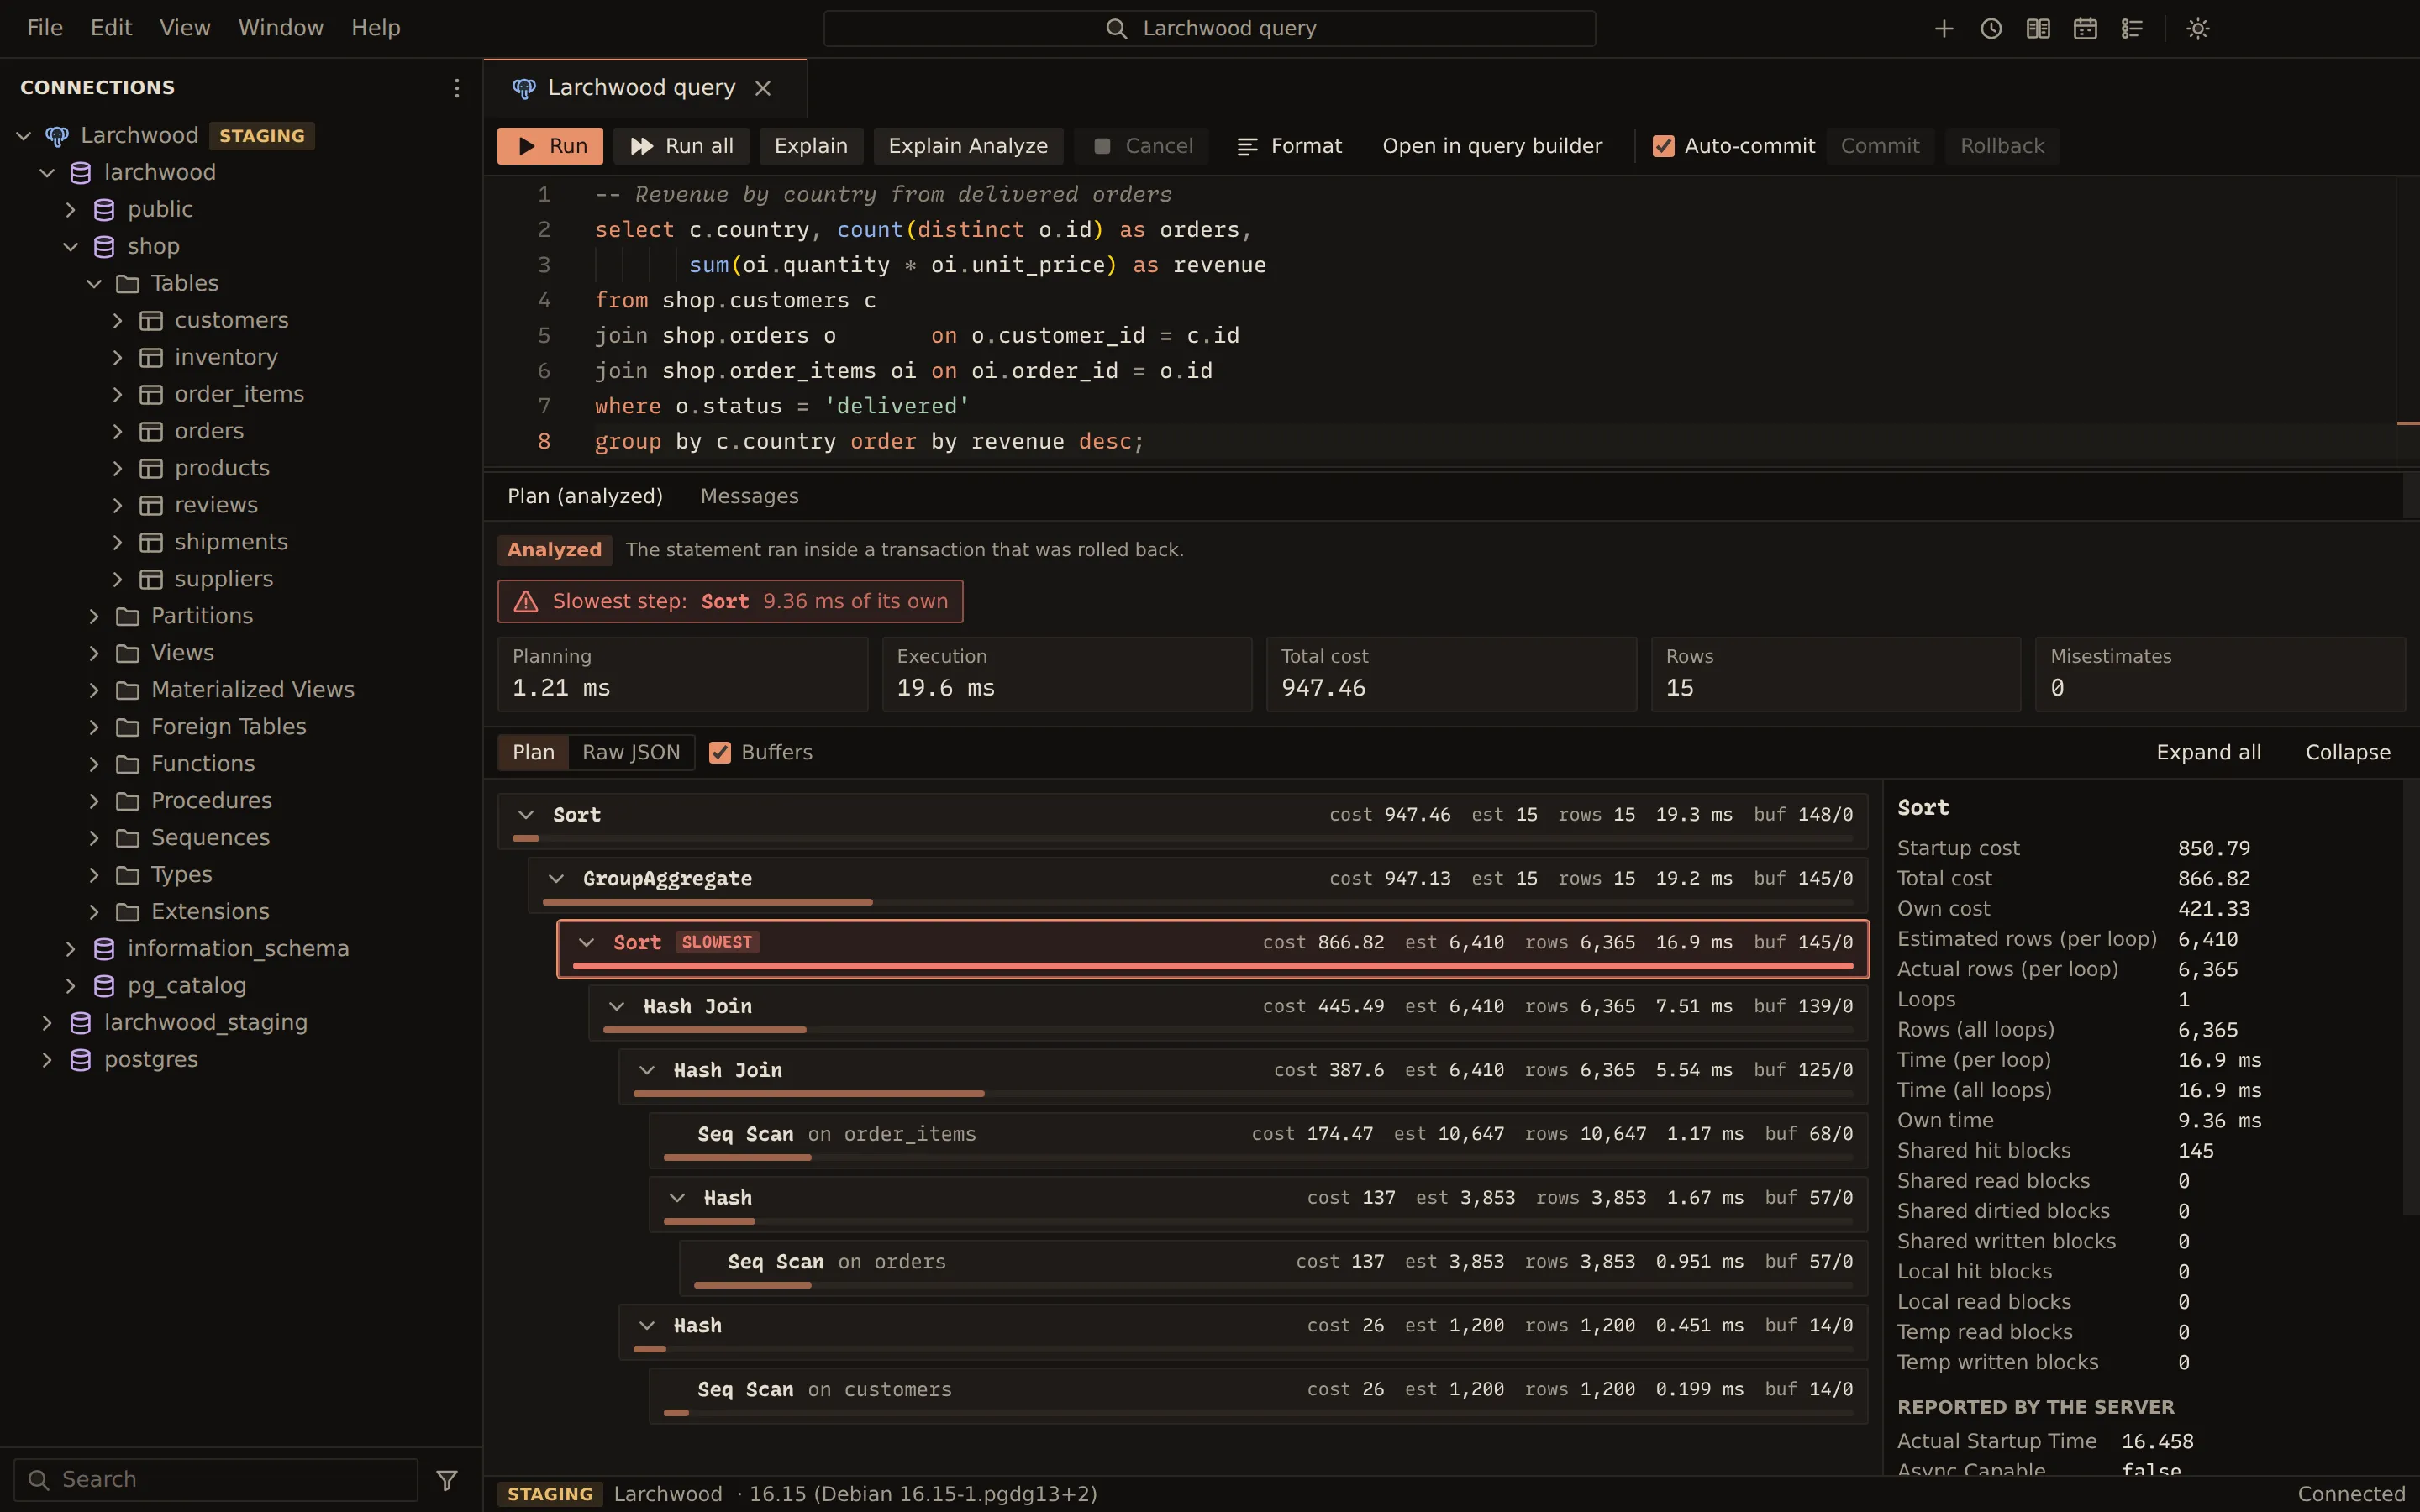
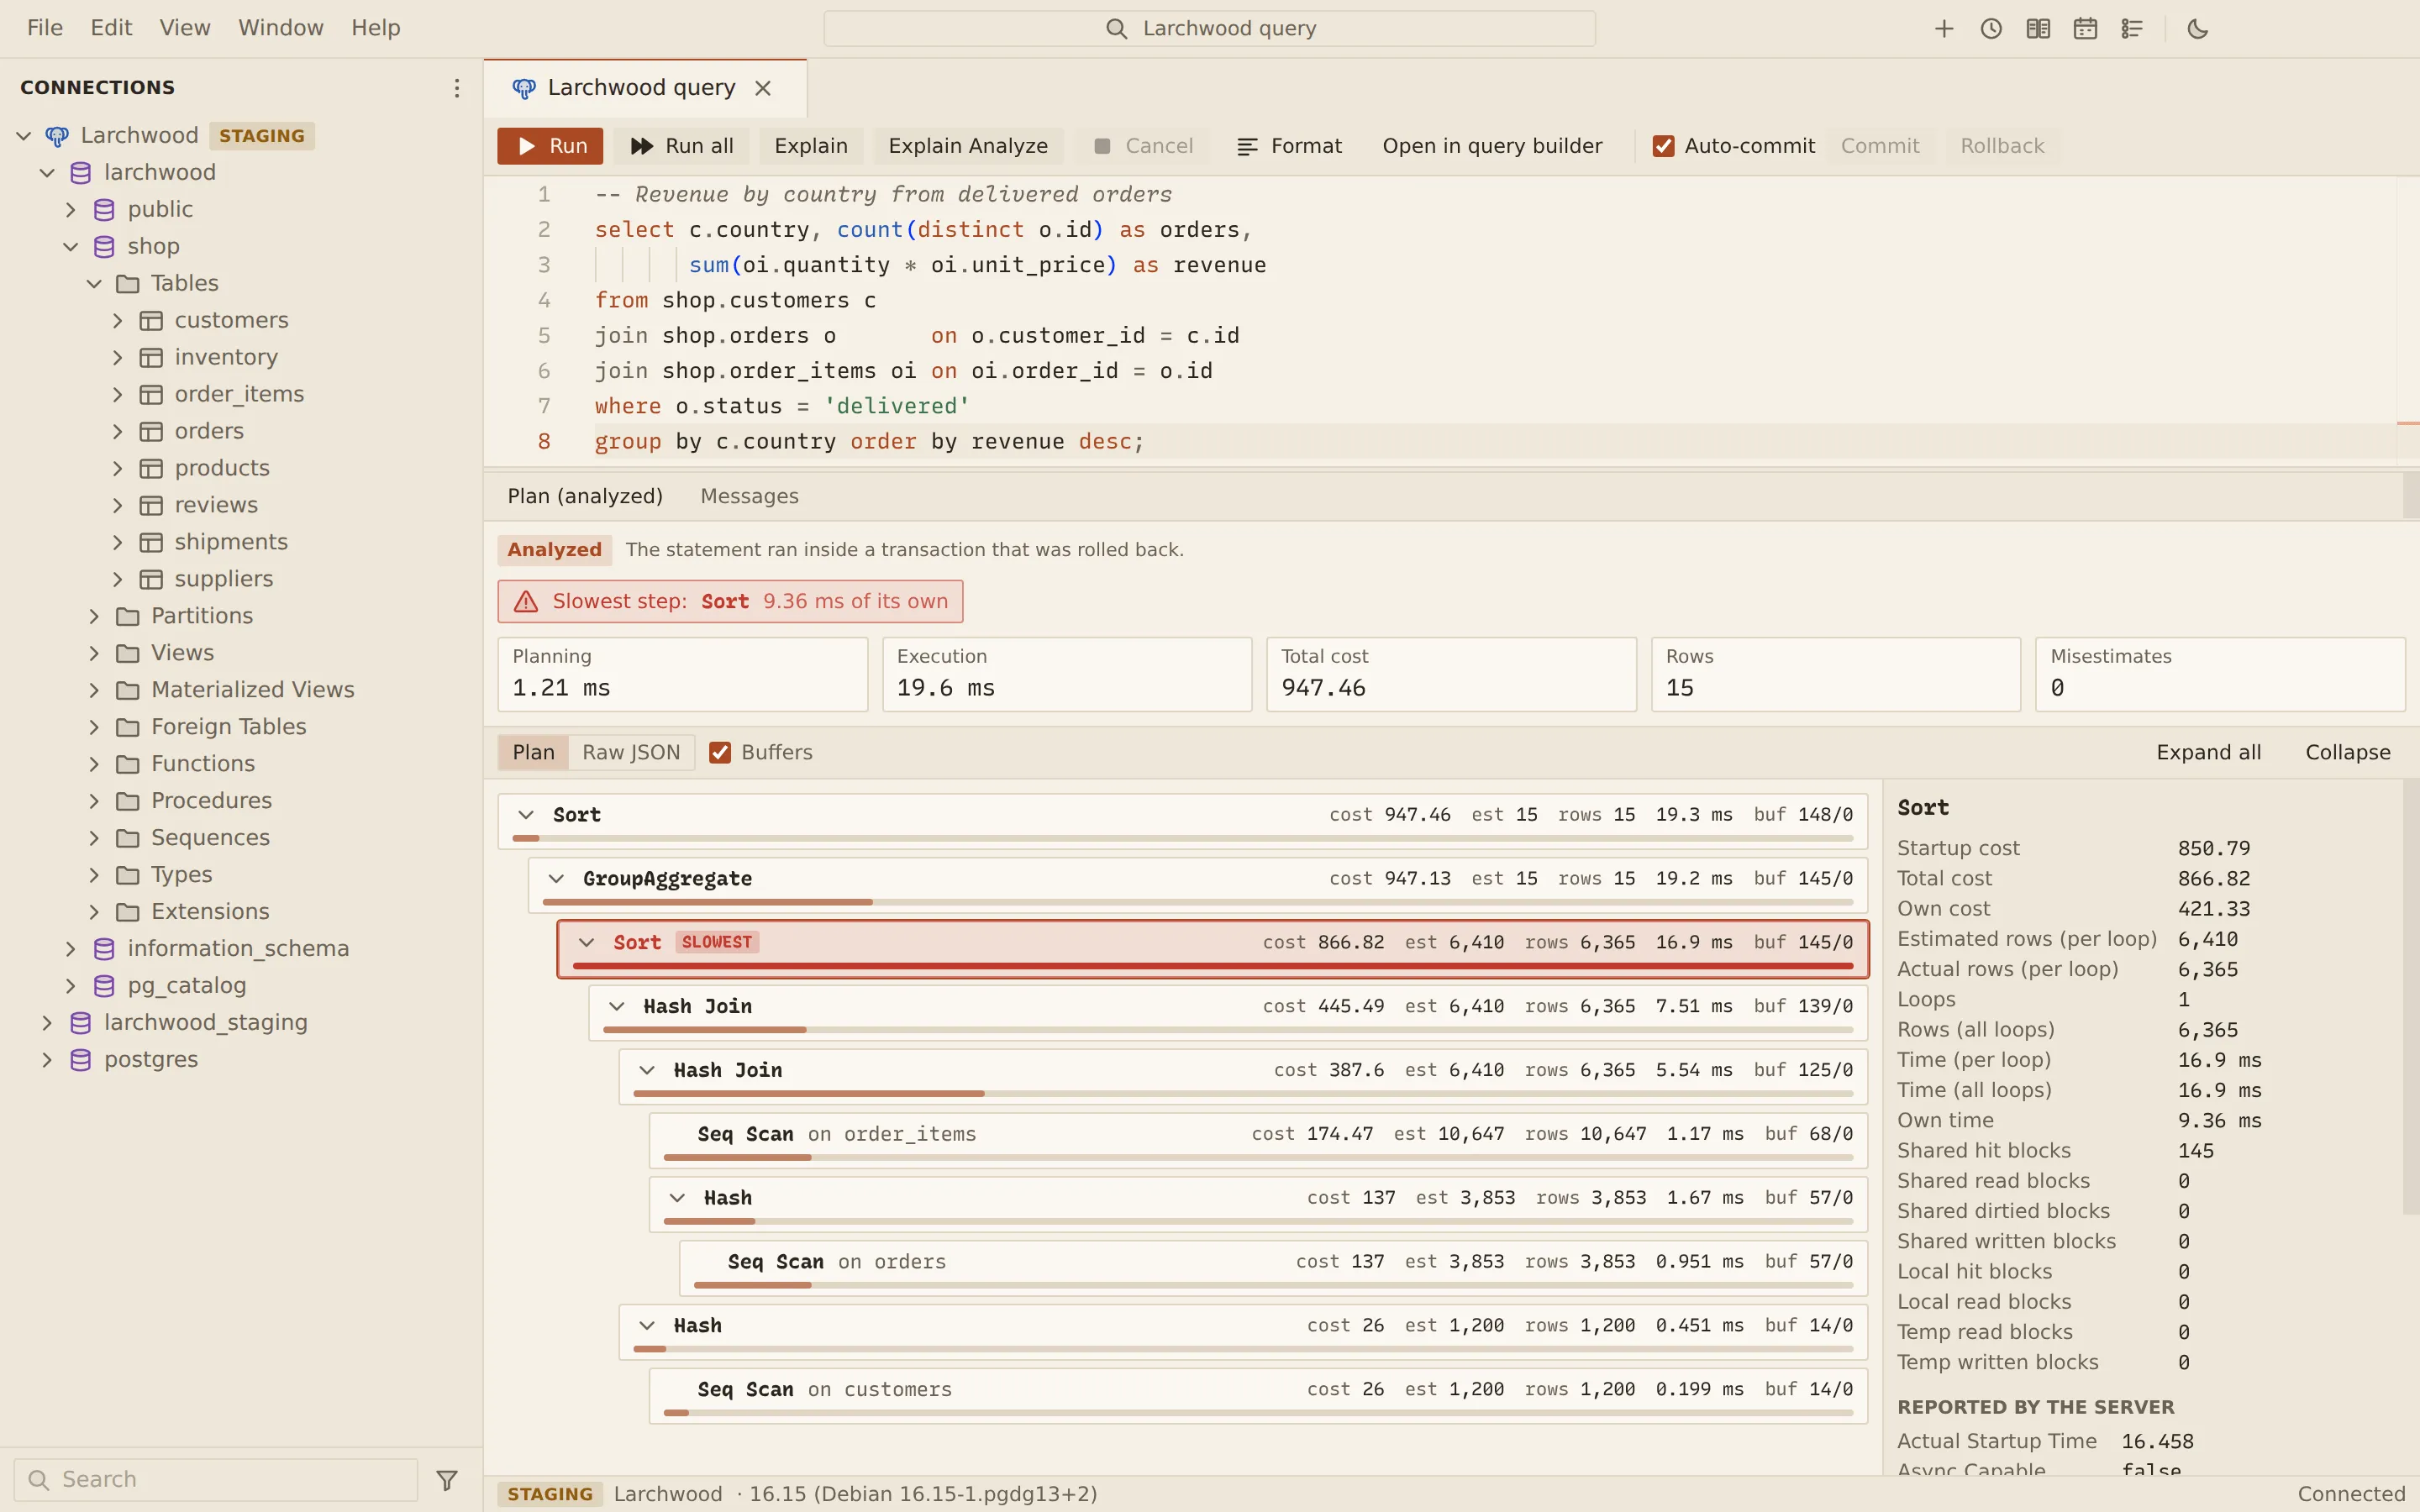
Explain a statement
Section titled “Explain a statement”- In a query tab, put the cursor in a statement, or select exactly one statement.
- Choose Explain (Ctrl + E) for the estimated plan, or Explain Analyze (Ctrl + Shift + E) to run and measure it. On macOS use Cmd.
- The plan opens in the Plan tab of the results, or Plan (analyzed) after Explain Analyze.
The statement runs on the tab’s own session, so its search_path, USE and open transaction
apply. Placeholders ask for values as they do when you run the statement.
| Engine | Explain | Explain Analyze |
|---|---|---|
| PostgreSQL | EXPLAIN (FORMAT JSON) |
EXPLAIN (FORMAT JSON, ANALYZE), with BUFFERS when ticked |
| MySQL | EXPLAIN FORMAT=JSON |
EXPLAIN ANALYZE |
| MariaDB | EXPLAIN FORMAT=JSON |
ANALYZE FORMAT=JSON |
When the server version cannot analyze, Explain Analyze is disabled with the reason in its tooltip.
Read the plan
Section titled “Read the plan”The summary at the top shows Planning and Execution time, Total cost, Rows (or Rows (est.) for an estimated plan) and the number of Misestimates. A badge says Analyzed or Estimated plan.
The tree lists each step with its operation, the table it reads and the index it uses, followed by its figures:
| Figure | Meaning |
|---|---|
cost |
Total cost of the step and its inputs |
est |
Rows the planner expected per loop |
rows |
Rows the step returned per loop (analyzed plans) |
loops |
Times the step ran, when more than once |
| time | Time over every loop, inputs included (analyzed plans) |
buf |
Shared blocks found in cache / read (PostgreSQL with Buffers) |
A bar under each step shows its share of the whole. Steps that never ran are dimmed and marked never executed.
- Slowest step. In an analyzed plan, the step with the most time of its own is highlighted and marked slowest. In an estimated plan, the step with the highest cost of its own is marked most expensive. The summary names it; click it to select that step.
- Misestimates. When actual rows differ from the estimate by a factor of 10 or more, the step shows ▲ (more rows than expected) or ▼ (fewer) with the factor.
Click a step, or move through the tree with the arrow keys, to see its details on the right: startup, total and own cost, estimated and actual rows per loop, loops, time per loop and over all loops, own time, the row estimate error, buffer counts, and everything else the server reported for that step.
| Control | What it does |
|---|---|
| Plan / Raw JSON or Raw text | Switch between the tree and the server’s own output |
| Expand all, Collapse | Open or fold the tree |
| Buffers (PostgreSQL) | Report shared, local and temporary blocks with the next Explain Analyze |
| Copy (raw view) | Copy the server’s output |
Explain Analyze of a statement that writes
Section titled “Explain Analyze of a statement that writes”Explain Analyze executes the statement. Querybara runs it inside a transaction, or a savepoint when one is open, and rolls it back. The plan then notes that the statement ran inside a transaction that was rolled back.
For a statement that writes (INSERT, UPDATE, DELETE and so on), Querybara asks first in a
dialog titled Run the statement to analyze it? Choose Analyze and roll back to go ahead.
On a read-only connection, Explain Analyze of a statement that writes is refused; use Explain for the estimated plan.
Related
Section titled “Related”Documents Querybara 0.1.1 · built frombc9f5aa