
Monitoring
- Redis / Valkey
The monitoring tools sit in the Tools folder under a Redis connection: INFO dashboard, Slow log, Clients, Latency, Monitor and Big keys. In Cluster mode each tool can look at one node; the dashboard, MONITOR and big keys can also cover every primary.
INFO dashboard
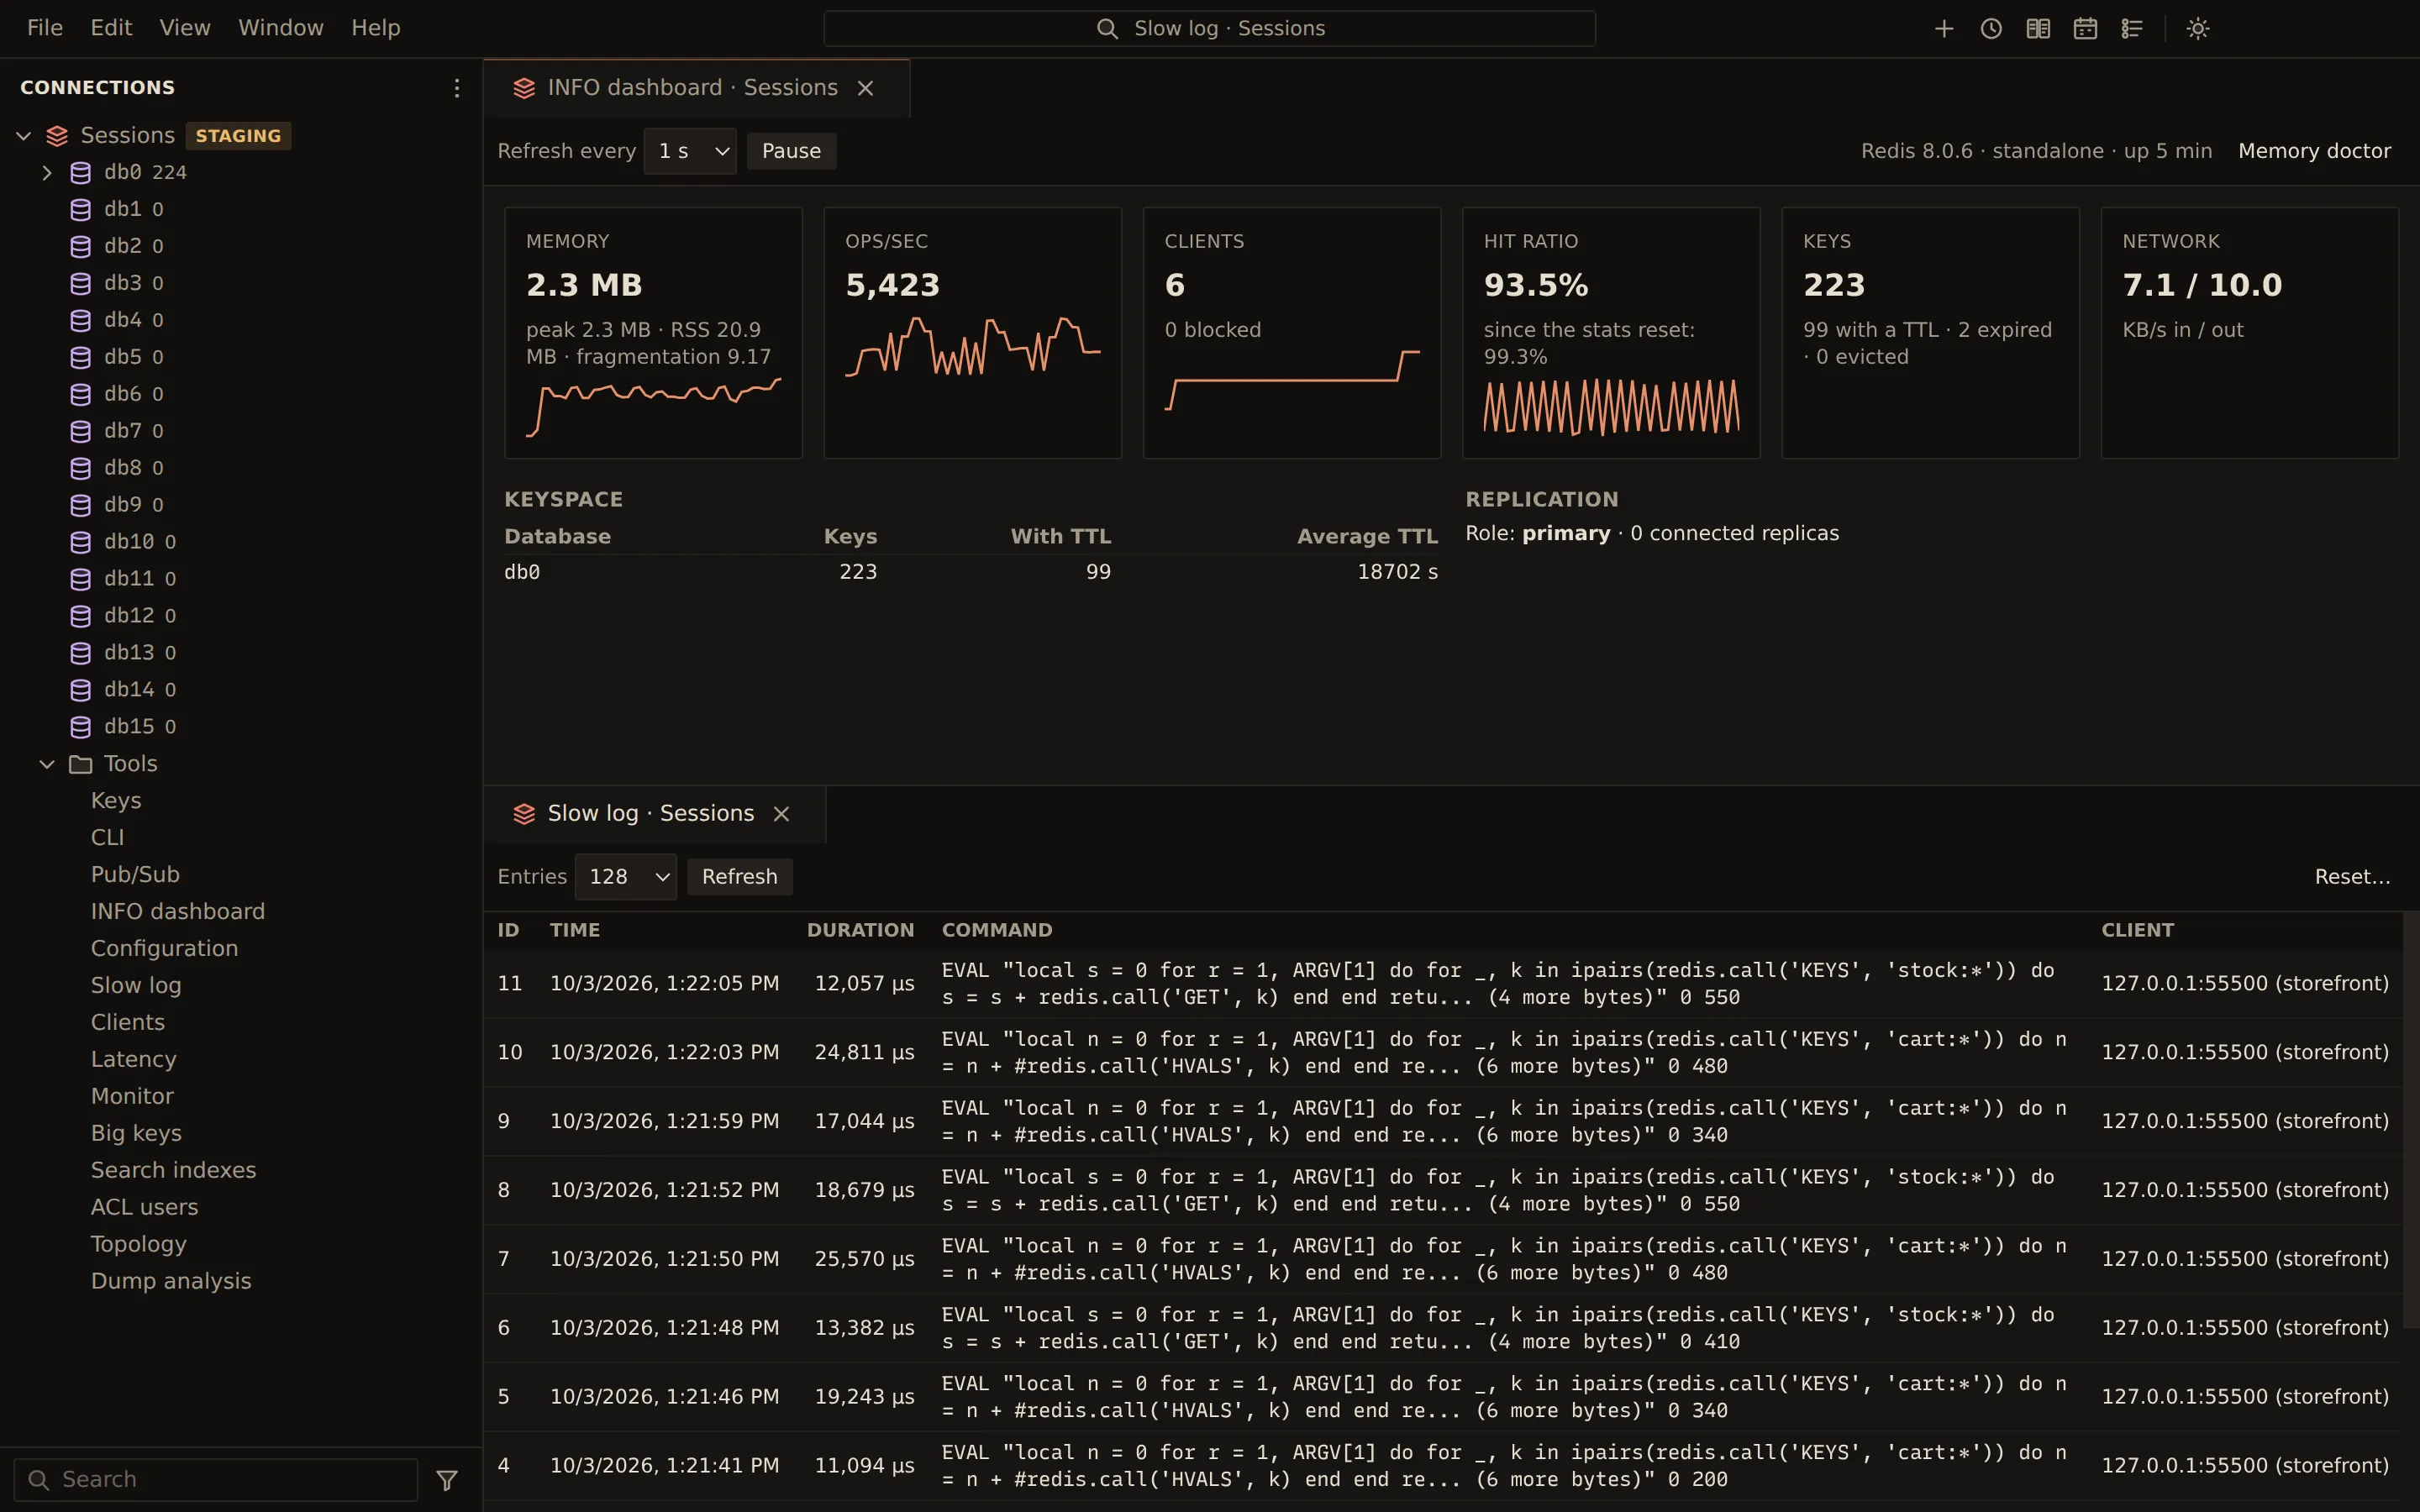
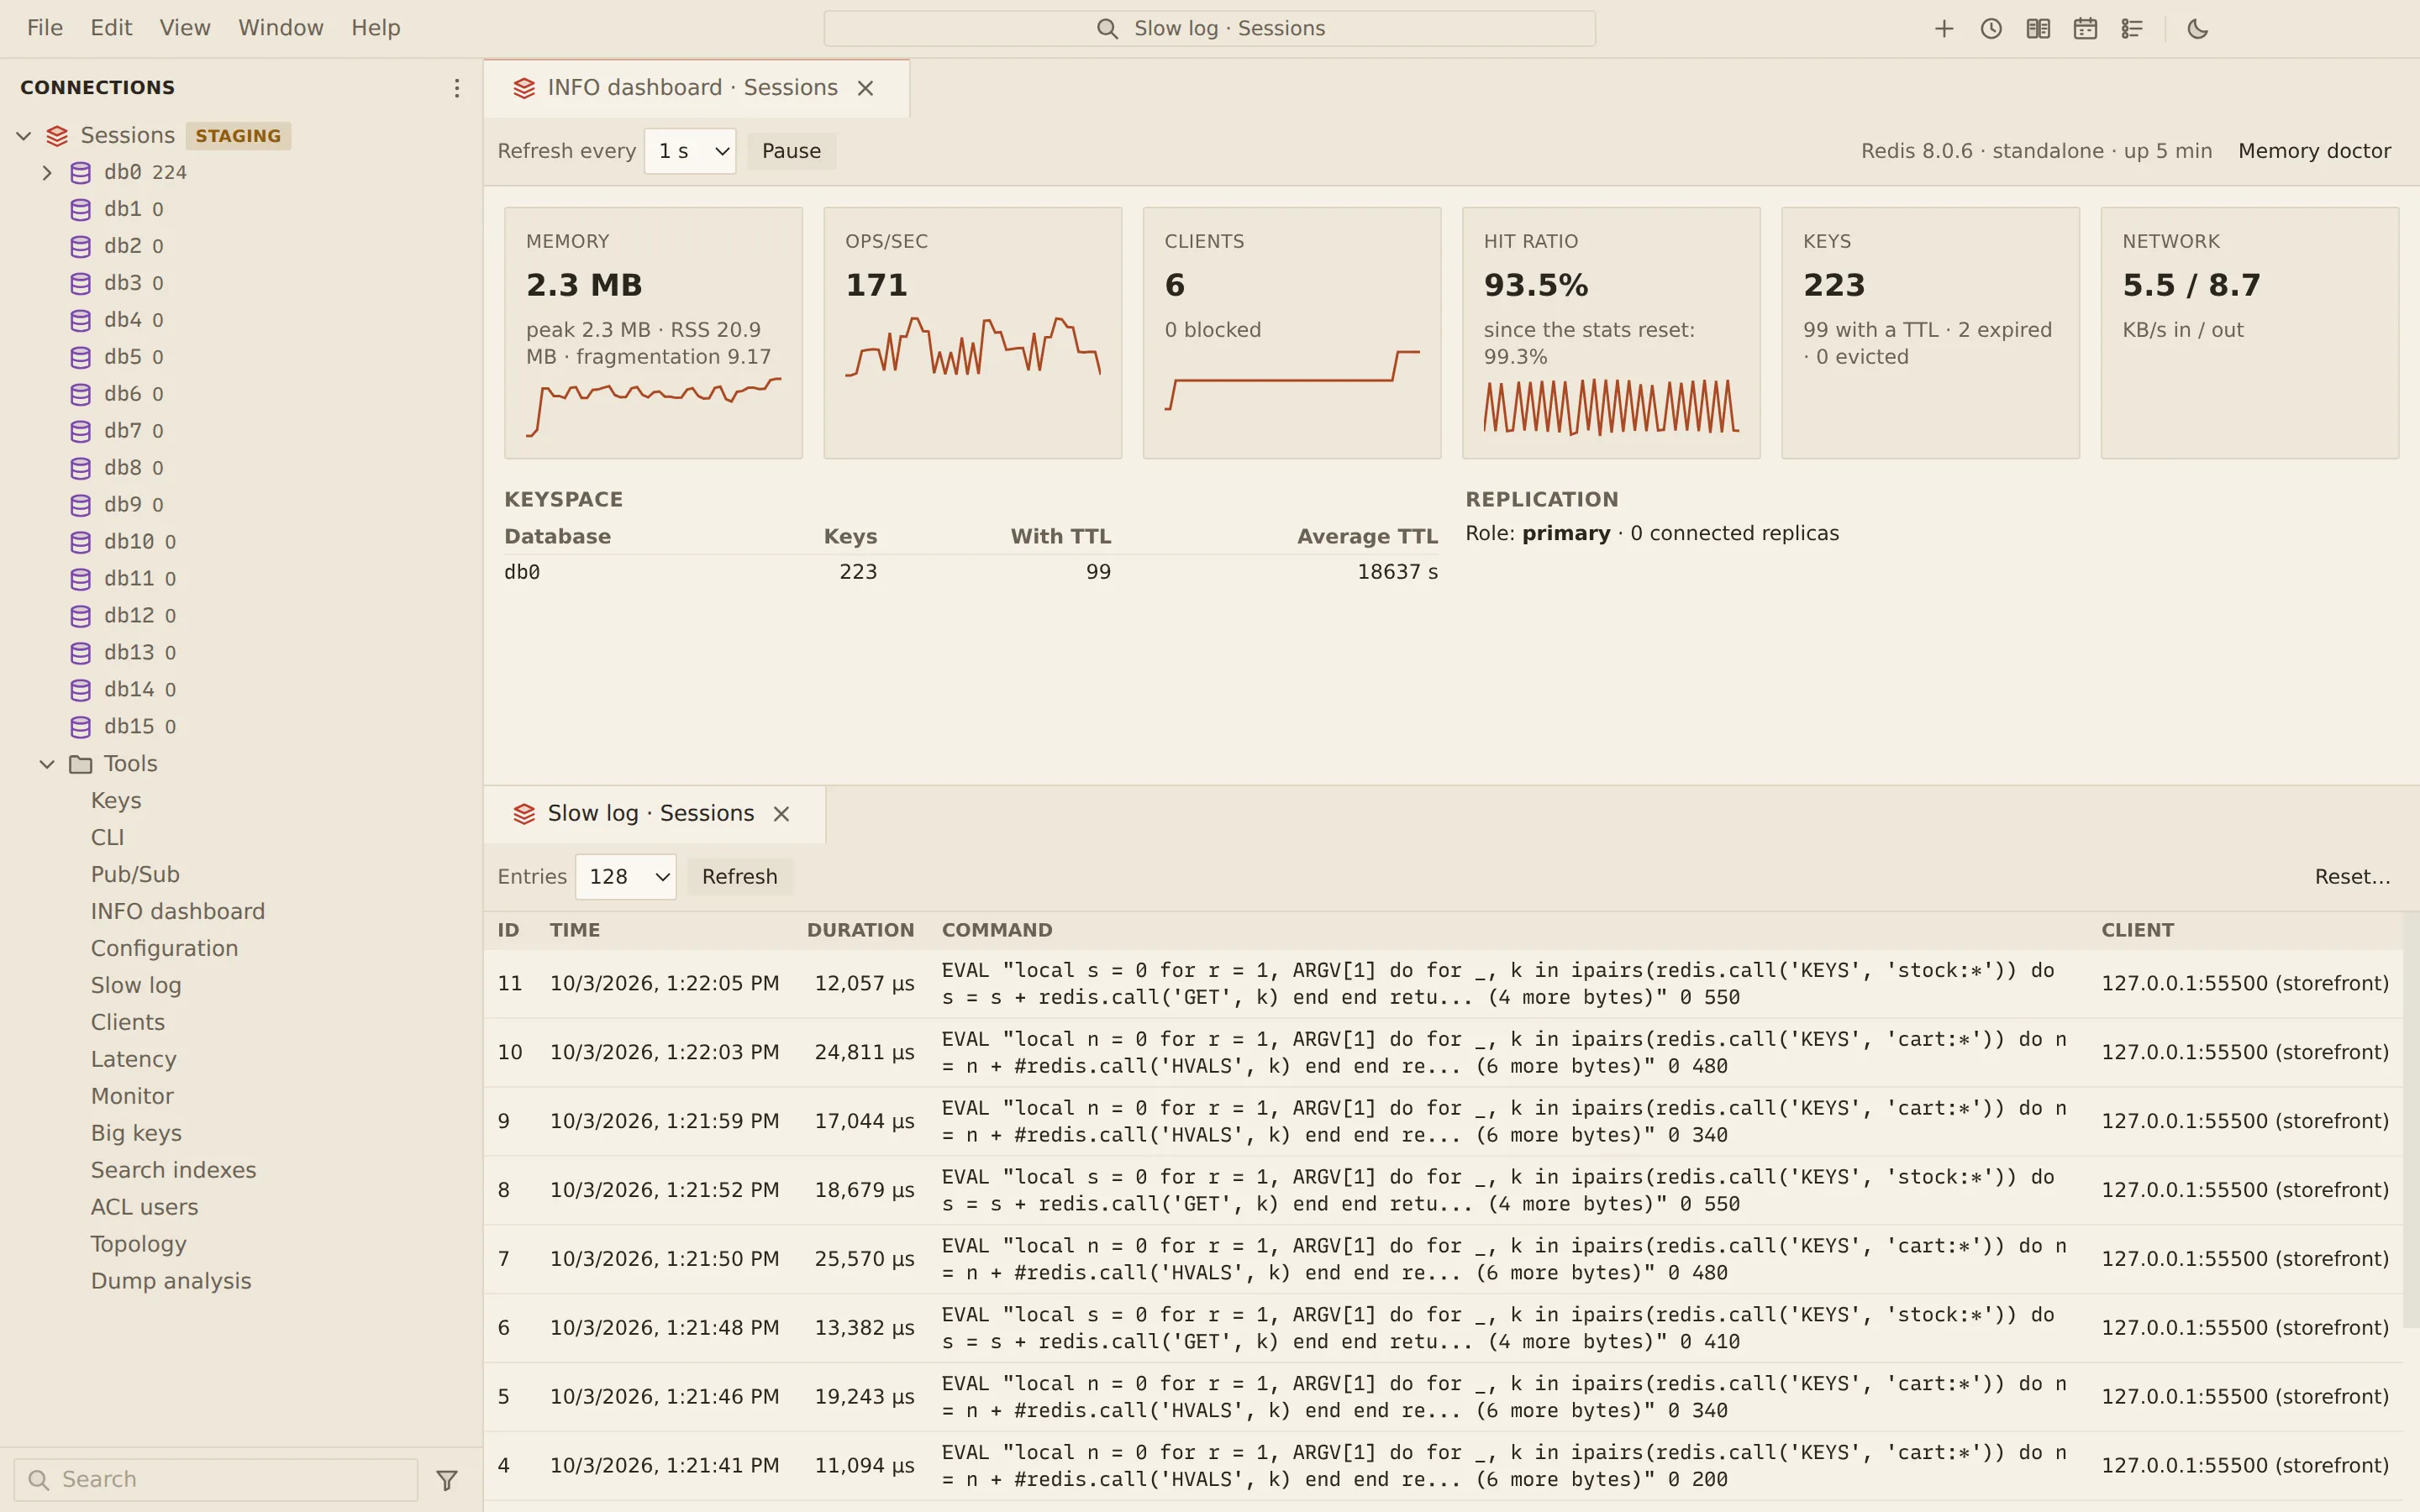
Section titled “INFO dashboard”The dashboard polls INFO and keeps the history for the session as small charts.
| Figure | Shows |
|---|---|
| Memory | Memory in use, of the limit if one is set, with peak, RSS and fragmentation. |
| Ops/sec | Operations per second. |
| Clients | Connected clients, and how many are blocked. |
| Hit ratio | The recent hit ratio, and the ratio since the statistics were last reset. |
| Keys | Keys in total, with a TTL, expired and evicted. |
| Network | Traffic in and out, in KB/s. |
Memory, Ops/sec, Clients and Hit ratio each have a chart of their history.
Below the figures, the keyspace table lists each Database with its Keys, keys With TTL and Average TTL, and Replication shows the server’s role (primary or replica), its primary and link status, or its connected replicas with their state, offset and lag.
- Refresh every sets the polling interval: 1, 2, 5 (the default), 10, 30 or 60 seconds.
- Pause stops polling; Resume continues.
- Node picks one node in Cluster mode; by default the figures add up every primary.
- Memory doctor shows the server’s
MEMORY DOCTORadvice.
The toolbar also shows whether the server is Redis or Valkey, its version and its uptime.
Slow log
Section titled “Slow log”- Open Tools › Slow log.
- Pick how many Entries to read: 32, 128, 512 or 1024. In Cluster mode, pick the Node.
- Read the ID, Time, Duration, Command and Client of each entry. Refresh reads the log again.
Reset… clears the slow log after a confirmation.
Clients
Section titled “Clients”Tools › Clients lists the connected clients with their ID, Address, Name, User, DB, Age, Idle time, Last command and Flags. Client type narrows the list to Normal, Pub/Sub, Replicas or Master clients. Kill disconnects a client after a confirmation.
Latency
Section titled “Latency”Tools › Latency shows the latency monitor’s events: for each Event, the Latest spike, the Latest latency and the All-time max, with a chart of its history.
- The monitor records spikes above Threshold (ms, 0 = off). When it is 0, the panel says the latency monitor is off; enter a threshold and choose Set to turn it on.
- Doctor shows the server’s latency advice.
- Reset… clears the latency history after a confirmation.
MONITOR
Section titled “MONITOR”Tools › Monitor streams every command the server runs. Choose Start MONITOR, then Stop MONITOR when you have seen enough; Clear empties the list. The panel keeps the latest 2,000 commands, and in Cluster mode shows which node ran each one.
Big keys
Section titled “Big keys”Tools › Big keys samples keys with SCAN, sizes them with MEMORY USAGE and groups them by
key pattern, with numbers and IDs replaced by *.
- Set the Sample size (5,000 by default) and, optionally, a key pattern.
- Choose Analyse. Cancel stops the run; the figures then cover the keys sampled so far.
- Read the summary: Sampled, Sampled memory, Estimated total and Time.
The Patterns table shows each pattern’s Keys, Memory, Share, Average,
Largest and Types. Largest keys lists the 50 biggest keys with their Type,
Memory, Length and TTL. If the server refuses MEMORY USAGE, the report says the sizes
are unknown.
Big keys samples the live server. To see every key without touching the server, read an RDB file offline with Dump analysis. Before a run, the Big keys panel links to it: Analyse a dump file instead.
Related
Section titled “Related”Documents Querybara 0.1.1 · built frombc9f5aa