
Dump analysis
- Redis / Valkey
Dump analysis reads an RDB file, the snapshot Redis and Valkey save to disk, and reports what fills it: keys by type and encoding, by expiry, by database and by key pattern, and the largest keys. It reads every key in the file, not a sample, and connects to no server, so you can analyse a dump from a production server on your own computer. Files of any size stream through.
It reads dumps written by Redis 2 to 8.6 and Valkey 7 to 9, module types such as JSON, time series and Bloom filters included.
Get a dump file
Section titled “Get a dump file”redis-cli --rdb dump.rdbcopies a running server’s data to a file.BGSAVEmakes the server save its RDB file (dump.rdbby default) in its data directory. In Querybara, the Back up keys… dialog has a Server snapshot (BGSAVE)… button; see Backup and restore.- Managed Redis services offer RDB files as backups.
Analyse a file
Section titled “Analyse a file”- Open Dump analysis from the Tools folder of any Redis connection, or choose Analyse a dump file instead in Big keys. The panel belongs to no connection, so there is one for the whole app.
- Optionally change the Pattern delimiter,
:by default. Key names split on it for the pattern report. - Choose Choose RDB file… and pick the file.
- Watch the progress: the share read, the bytes, the rate and the time left. Cancel stops the reading; closing the panel does too.
The file is read in a separate process, so the app stays responsive. To read another file, choose Analyse another file…; its report replaces the current one.
Read the report
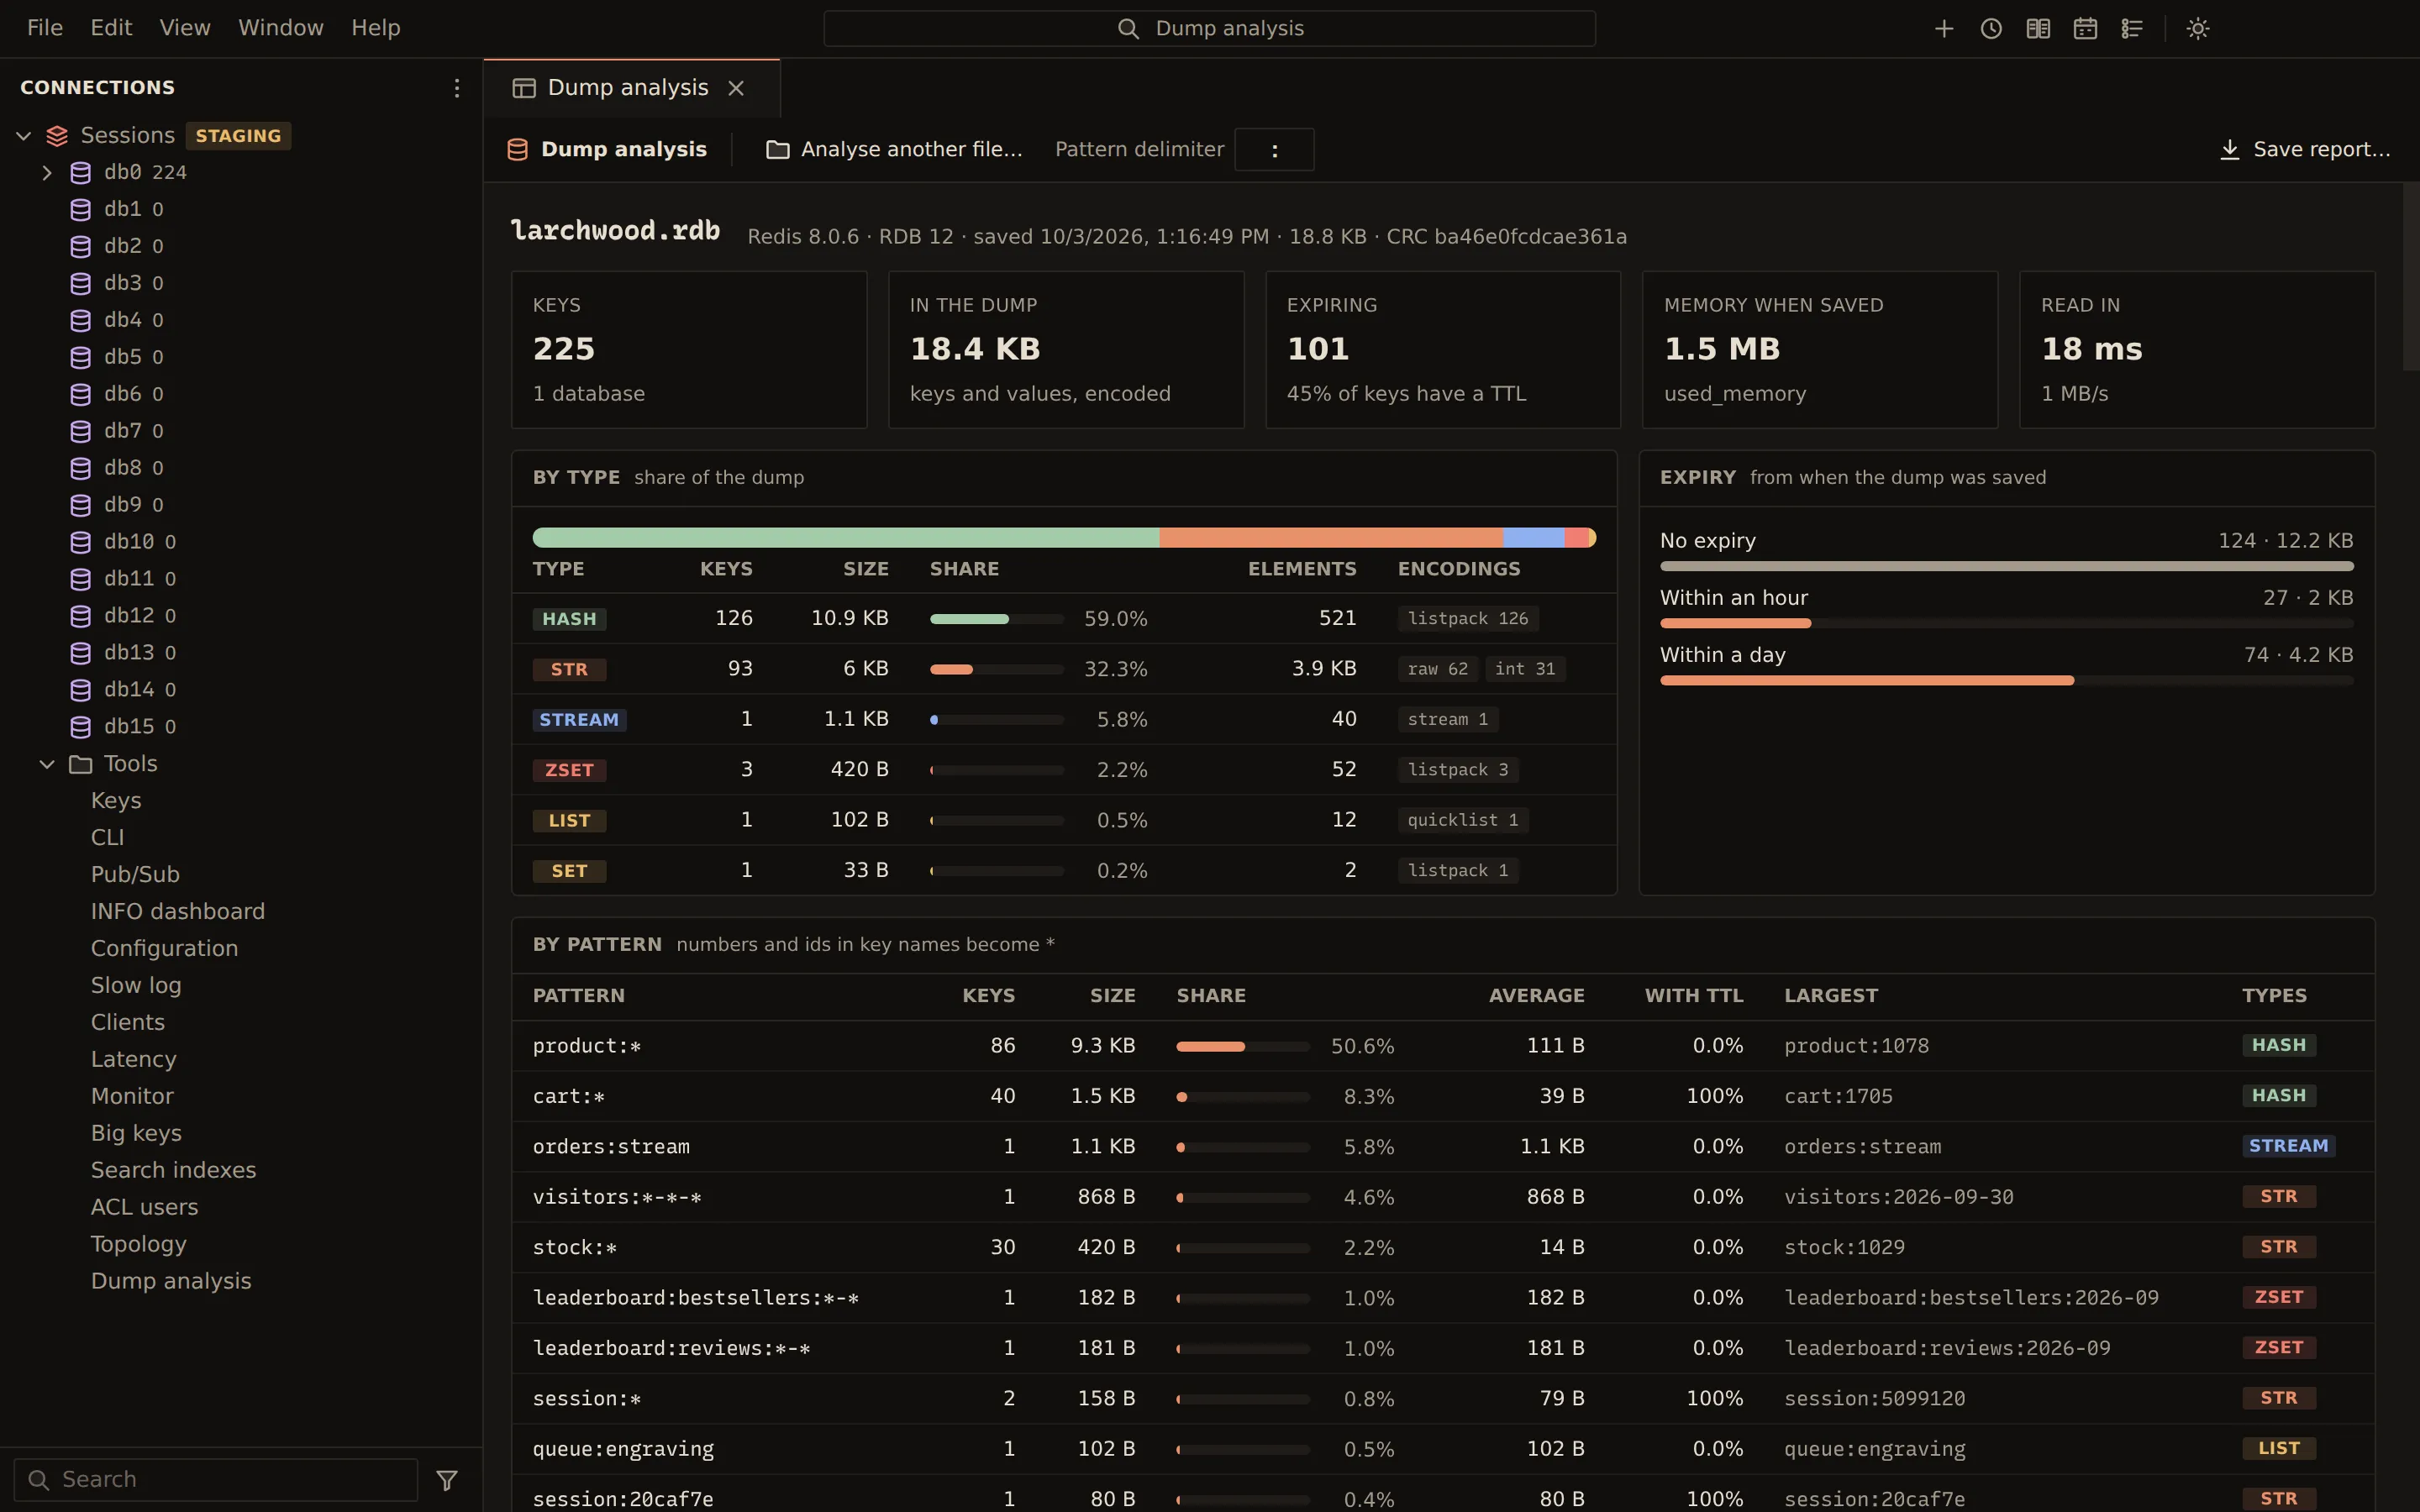
Section titled “Read the report”The top line names the file, the server and version that wrote it, the RDB version, when it was saved, its size and its CRC. The CRC is shown, not checked.
| Figure | Shows |
|---|---|
| Keys | The number of keys, and in how many databases. |
| In the dump | The bytes the keys and values take in the file. |
| Expiring | Keys with a TTL, and their share of all keys. |
| Memory when saved | The server’s memory use when it saved the file, if the dump records it. |
| Read in | How long the reading took, and the rate. |
The sections below:
- By type: each type with its Keys, Size, Share, Elements and Encodings,
such as
listpackorhashtable. Module types are named by what they are, with their registered name, such asReJSON-RL. - Expiry: keys by time left, No expiry, Already expired, Within an hour, Within a day, Within a week, Within a month and Later, measured from when the dump was saved (from now, if the file has no save time). Hash fields with their own expiry are counted too.
- By pattern: keys grouped by pattern, with numbers and ids replaced by
*(user:*:profile), with their Keys, Size, Share, Average, With TTL, Largest and Types. The first 50 show; Show all n patterns lists the rest. - Largest keys: the keys that take the most bytes in the dump, with DB, Type and encoding, Size, Elements and Expires.
- Most elements: the keys with the most fields, items or members.
- Databases: each database with its Keys, Size and Expiring count.
- Saved with it: the dump’s AUX fields, such as
redis-verandctime, with function libraries and module data when the file has them.
Hover a key in Largest keys or Most elements to show a button that copies its name.
If the file is damaged, or holds something the reader does not know, the reading stops there. The report then says at which byte it stopped and why, and covers the keys before it.
Save the report
Section titled “Save the report”Save report… saves the whole report as a JSON file, named after the dump by default.
Related
Section titled “Related”Documents Querybara 0.1.1 · built frombc9f5aa