
Top queries
- PostgreSQL
- MySQL
- MariaDB
- MongoDB
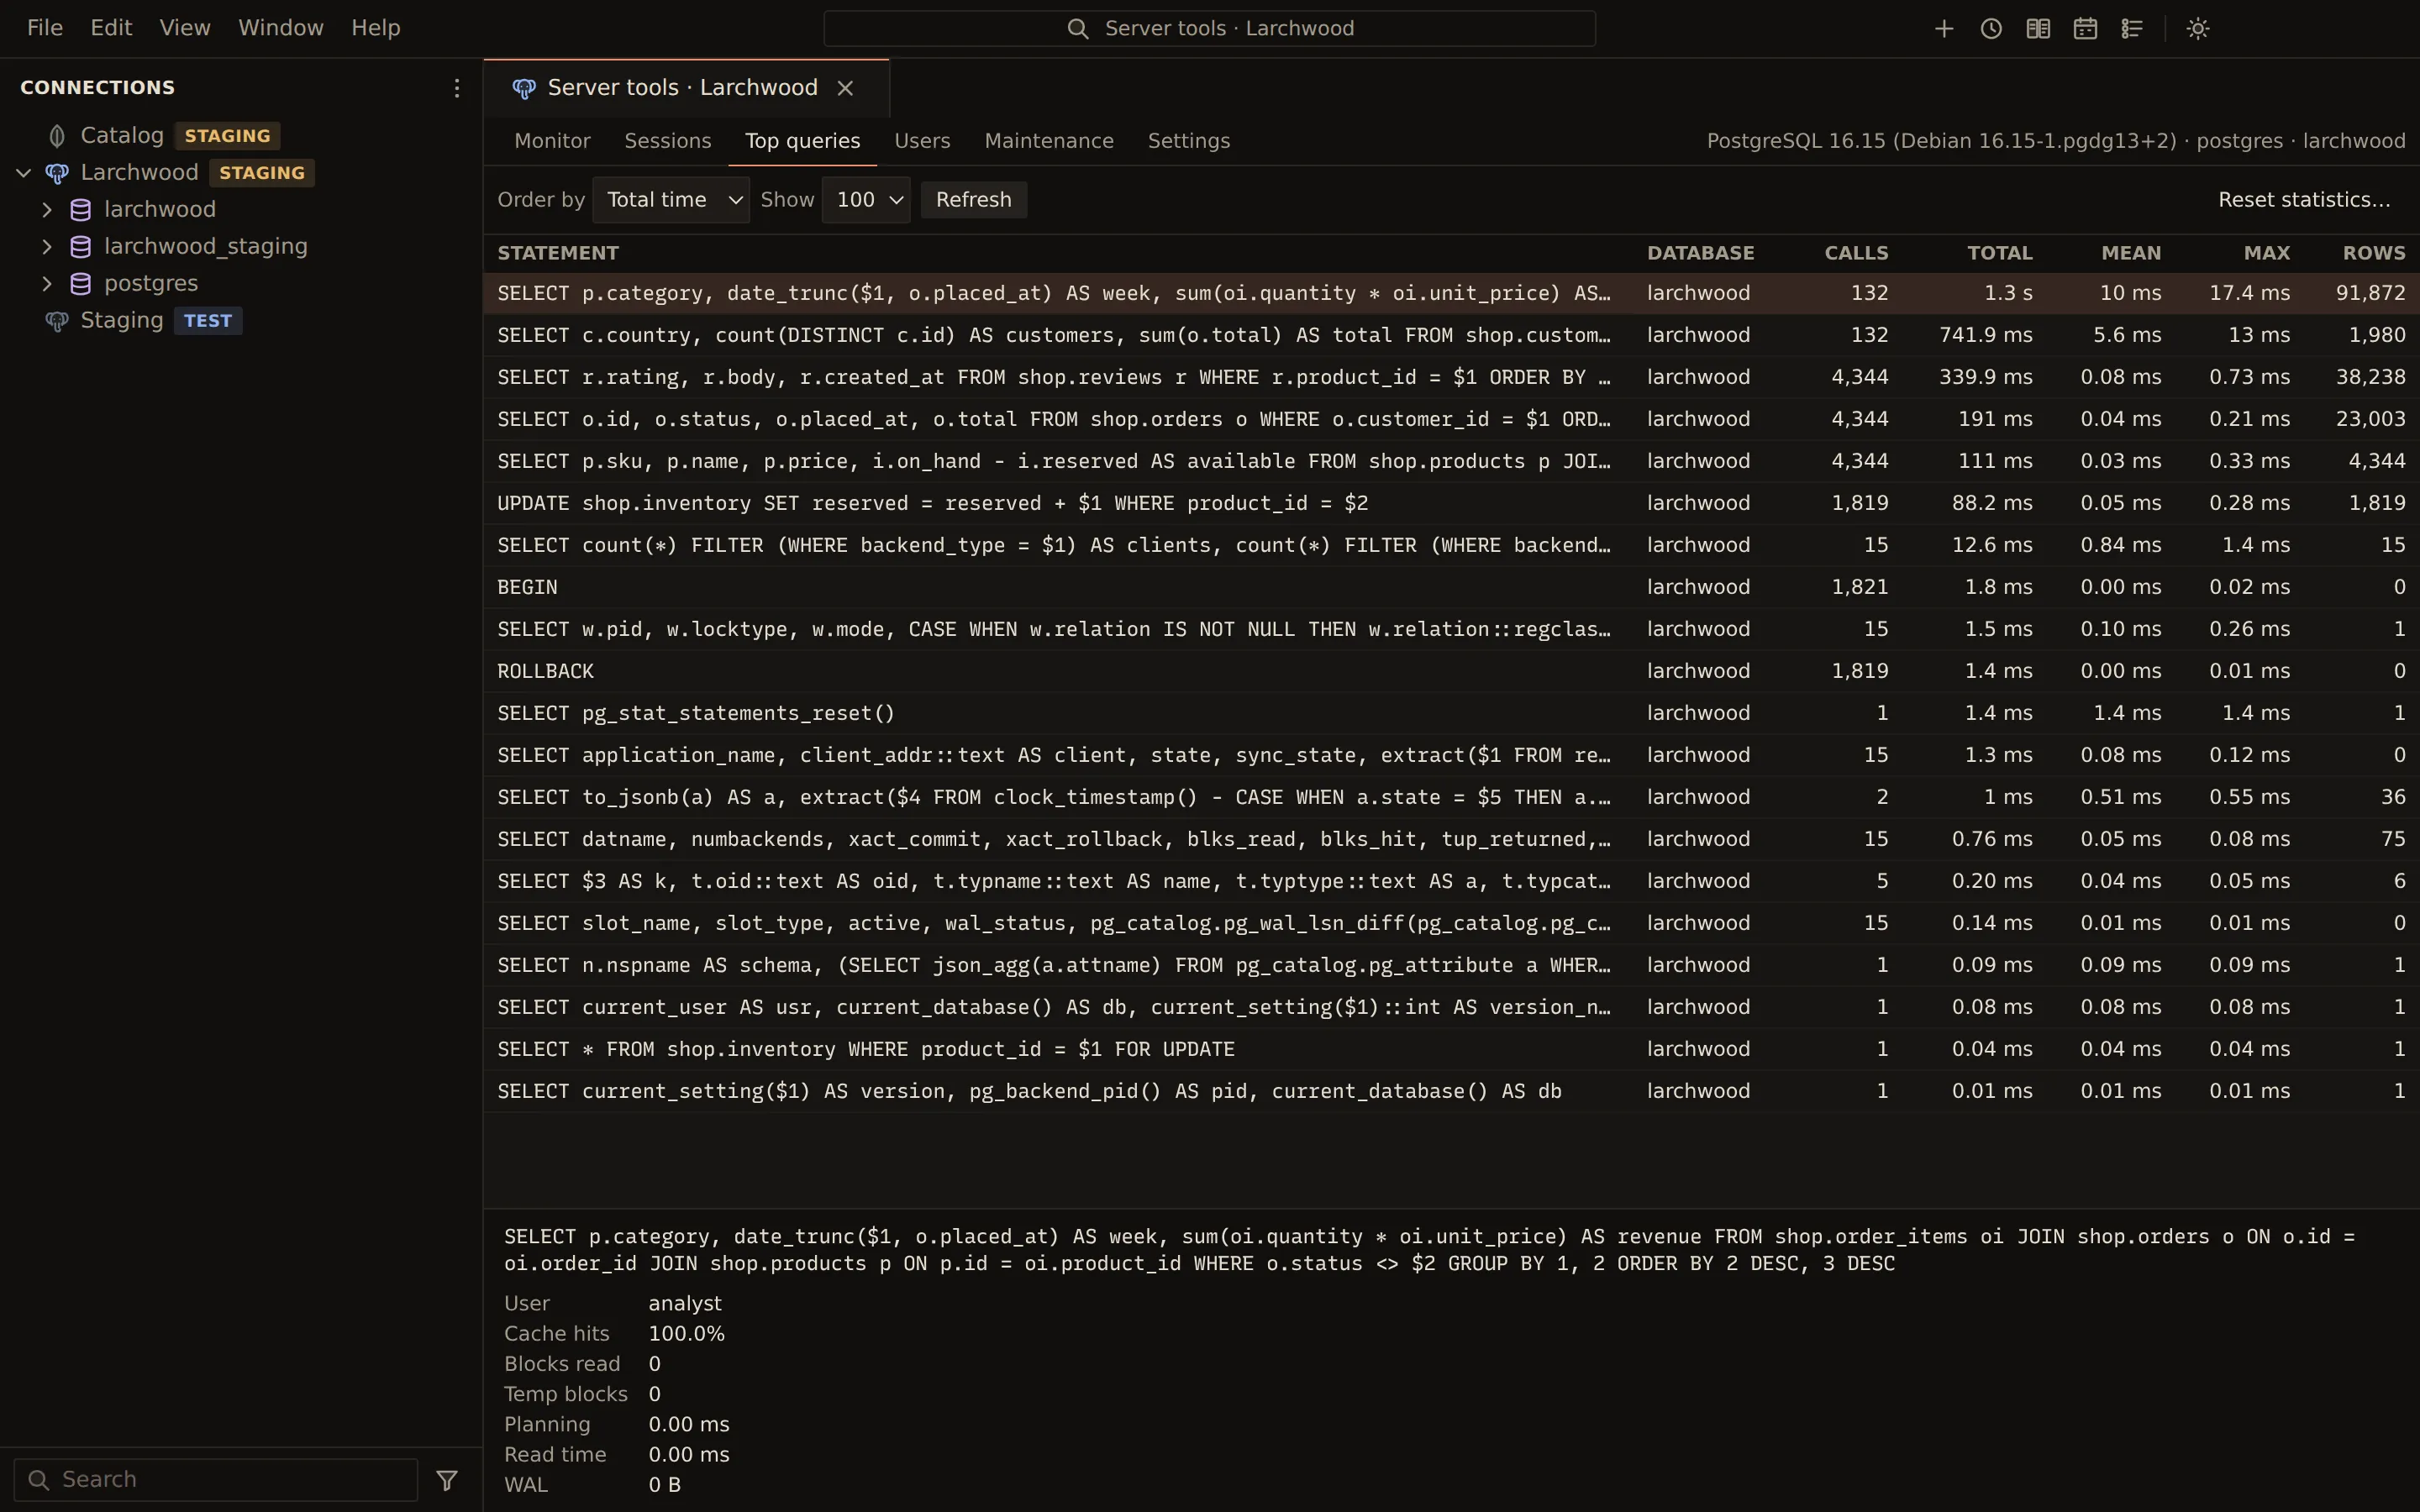
The Top queries tab ranks the statements the server has recorded. Querybara reads them from the source each engine has:
| Engine | Source |
|---|---|
| PostgreSQL | The pg_stat_statements extension |
| MySQL and MariaDB | The statement digests of performance_schema |
| MongoDB | The database profiler (system.profile), grouped by query shape |
Rank the statements
Section titled “Rank the statements”Open Server tools from the connection’s menu and pick Top queries.
| Control | What it does |
|---|---|
| Order by | Total time, Mean time, Calls, Rows or Max time |
| Show | 25, 100 or 500 statements |
| Database | MongoDB: the database whose profiler to read |
| Refresh | Reads the statistics again |
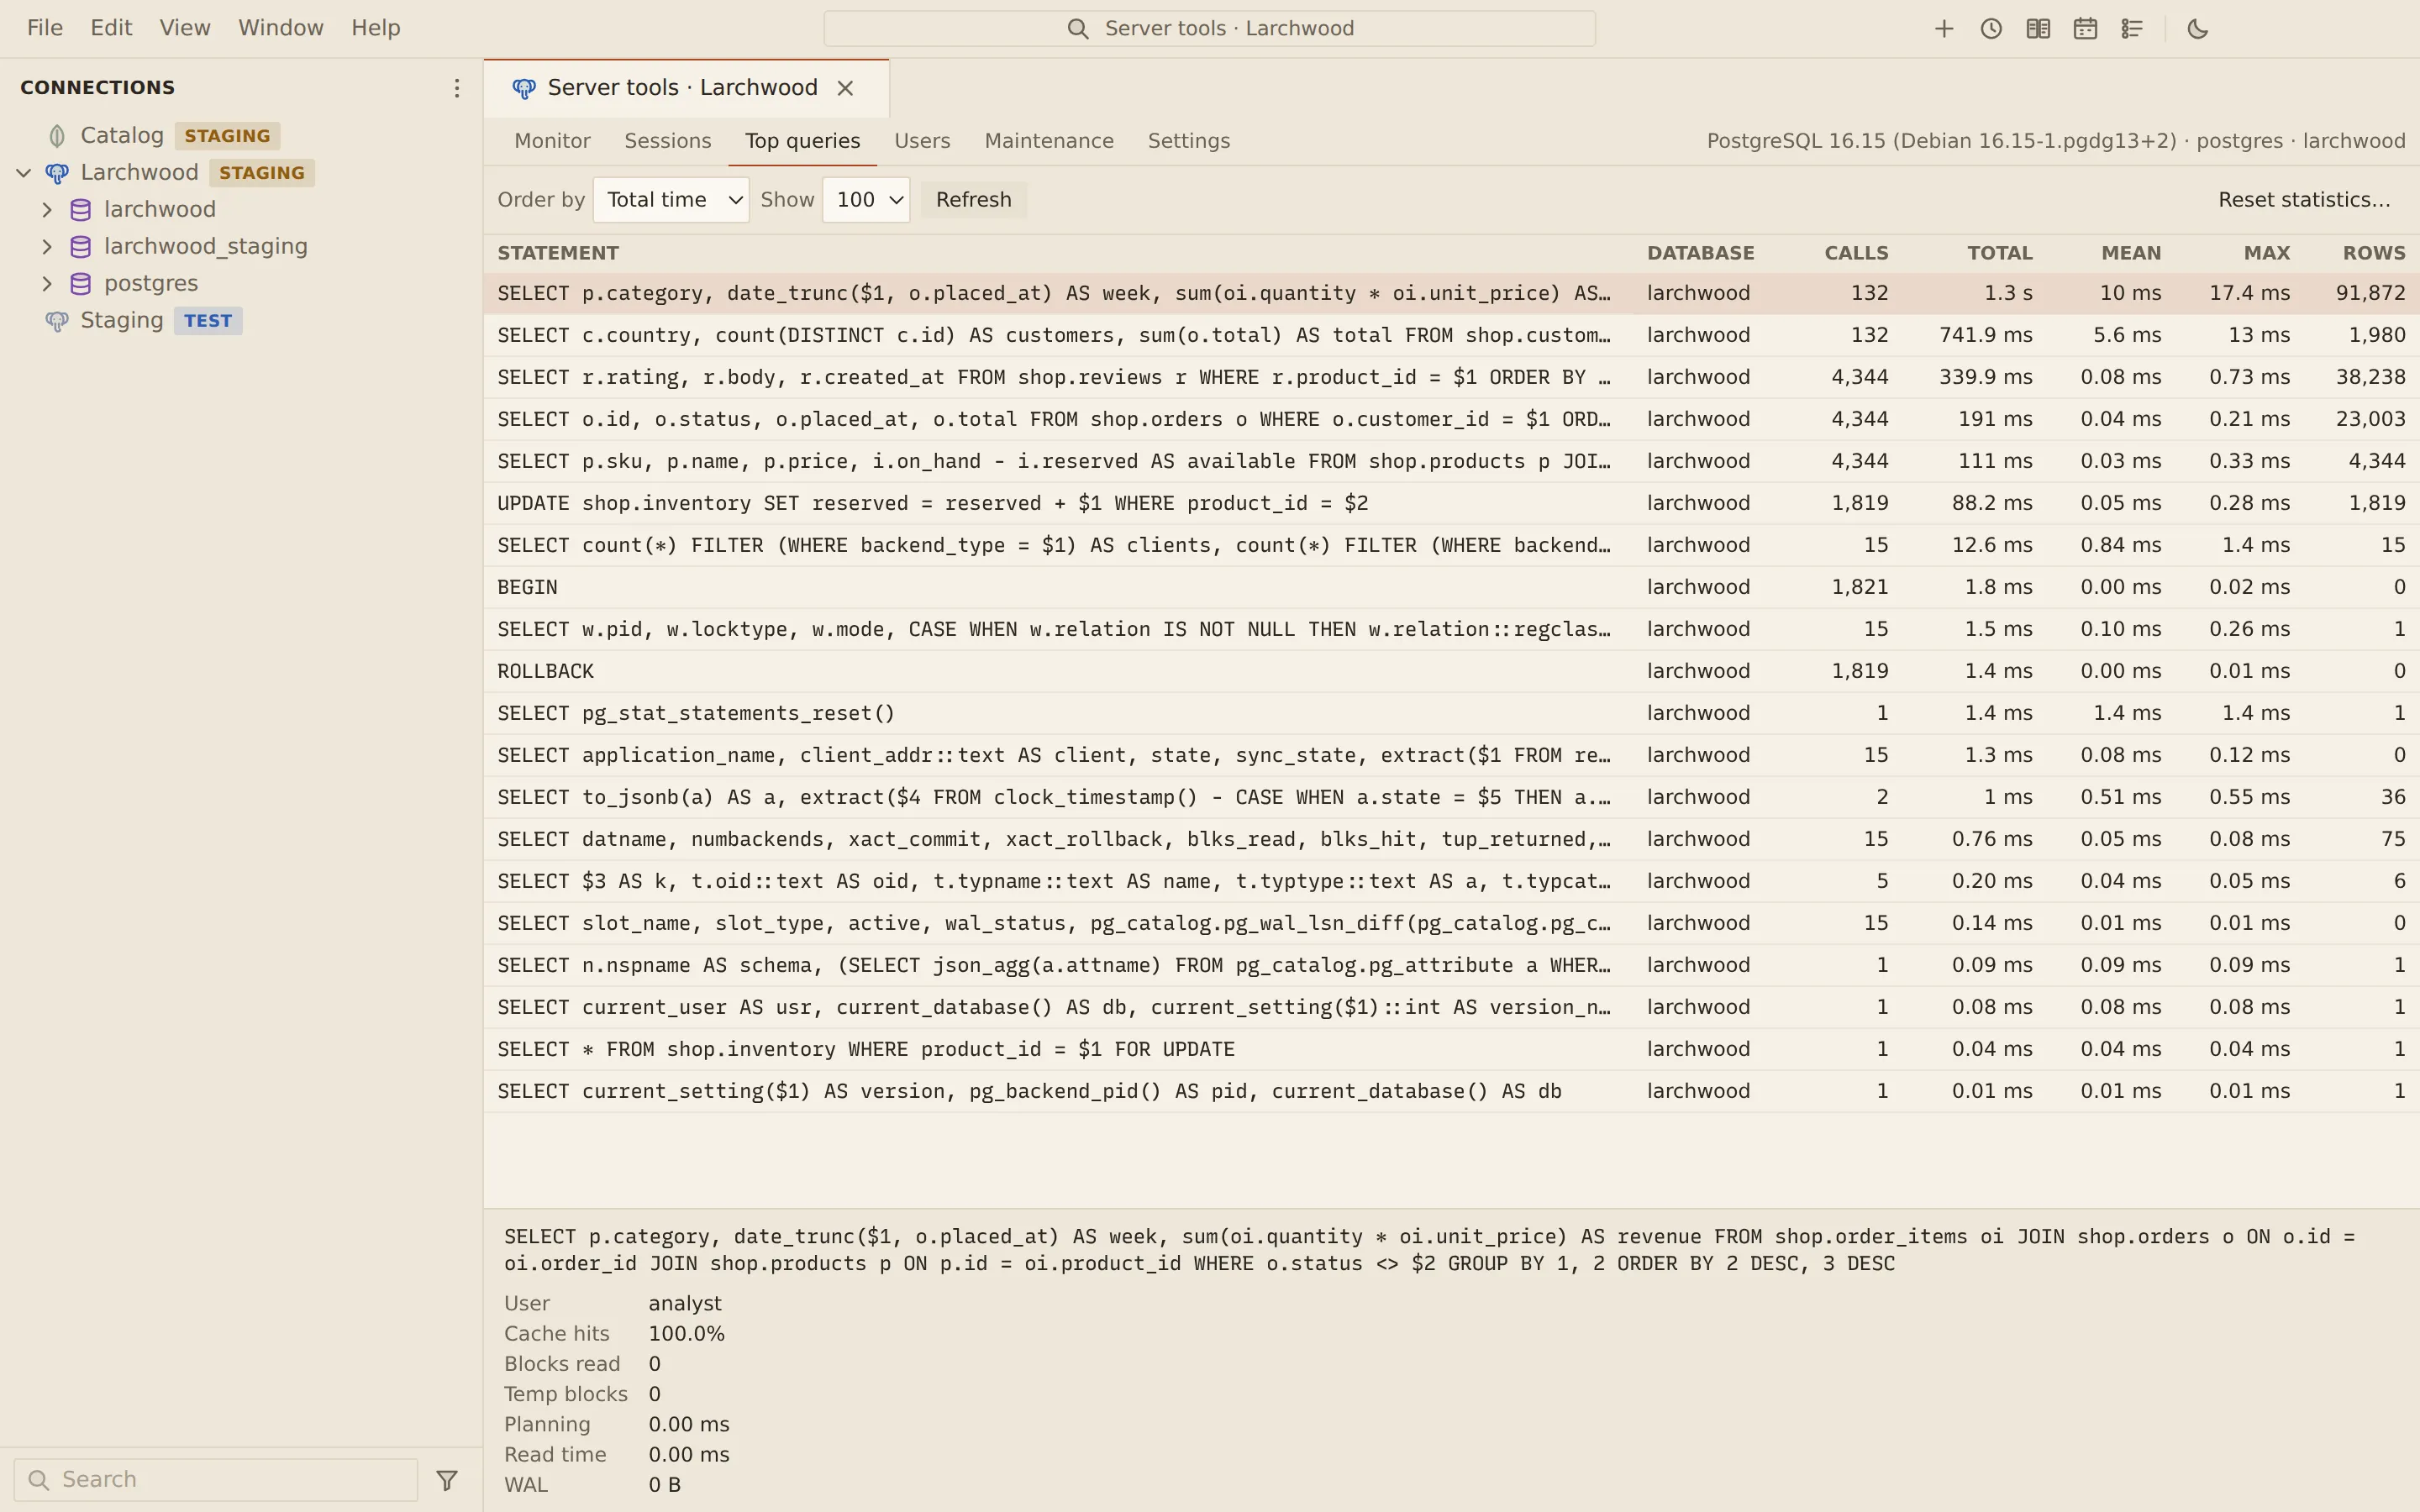
The table shows each statement with its database, calls, total, mean and max time, and rows. Select a row to see the full text and every other figure the source records, such as rows examined, rows without an index or temporary tables on disk on MySQL, or documents and keys examined and the plan on MongoDB.
Reset statistics… clears the recorded statistics, after showing the statement.
When the source is off
Section titled “When the source is off”If the source is missing, switched off, or the account cannot read it, the tab says why and how to fix it. Where the fix can run from Querybara, a button offers it, with the statement shown first.
| Situation | Fix shown |
|---|---|
pg_stat_statements is not available on the server |
Install the contrib package, add it to shared_preload_libraries, restart |
pg_stat_statements is installed but not loaded |
Add it to shared_preload_libraries and restart |
| The server has the extension but the database does not | Fix it… creates the extension; it also needs shared_preload_libraries and a restart if not set |
performance_schema is off |
Set performance_schema=ON in the option file and restart |
The statements_digest consumer is off |
Fix it… turns it on (it resets at restart unless set in the option file) |
The account cannot read performance_schema |
Grant SELECT on performance_schema.* |
| The MongoDB profiler is off for the database | Turn on the profiler… |
On PostgreSQL, statements of other roles are hidden unless the account is a member of
pg_read_all_stats; a notice says so.
On MongoDB the toolbar also shows the Profiler level and slowms, with Off, Slow only
and All to change the level.
Related
Section titled “Related”Documents Querybara 0.1.1 · built frombc9f5aa