
Cluster
- Elasticsearch
The cluster panel answers the questions that come up when a cluster turns yellow or red: which nodes are there, which shards are not started and why, how full each disk is, and what is running. Double-click Cluster in the sidebar to open it. Refresh in its toolbar reads everything again.
Health and nodes
Section titled “Health and nodes”The Health and nodes tab shows the cluster name and status, the server version, the number of nodes (and data nodes), active shards with the share that is active, and the relocating, initializing and unassigned shards and pending tasks.
The node table lists each node’s name, address, roles, heap, CPU, load, disk and version.
Shards
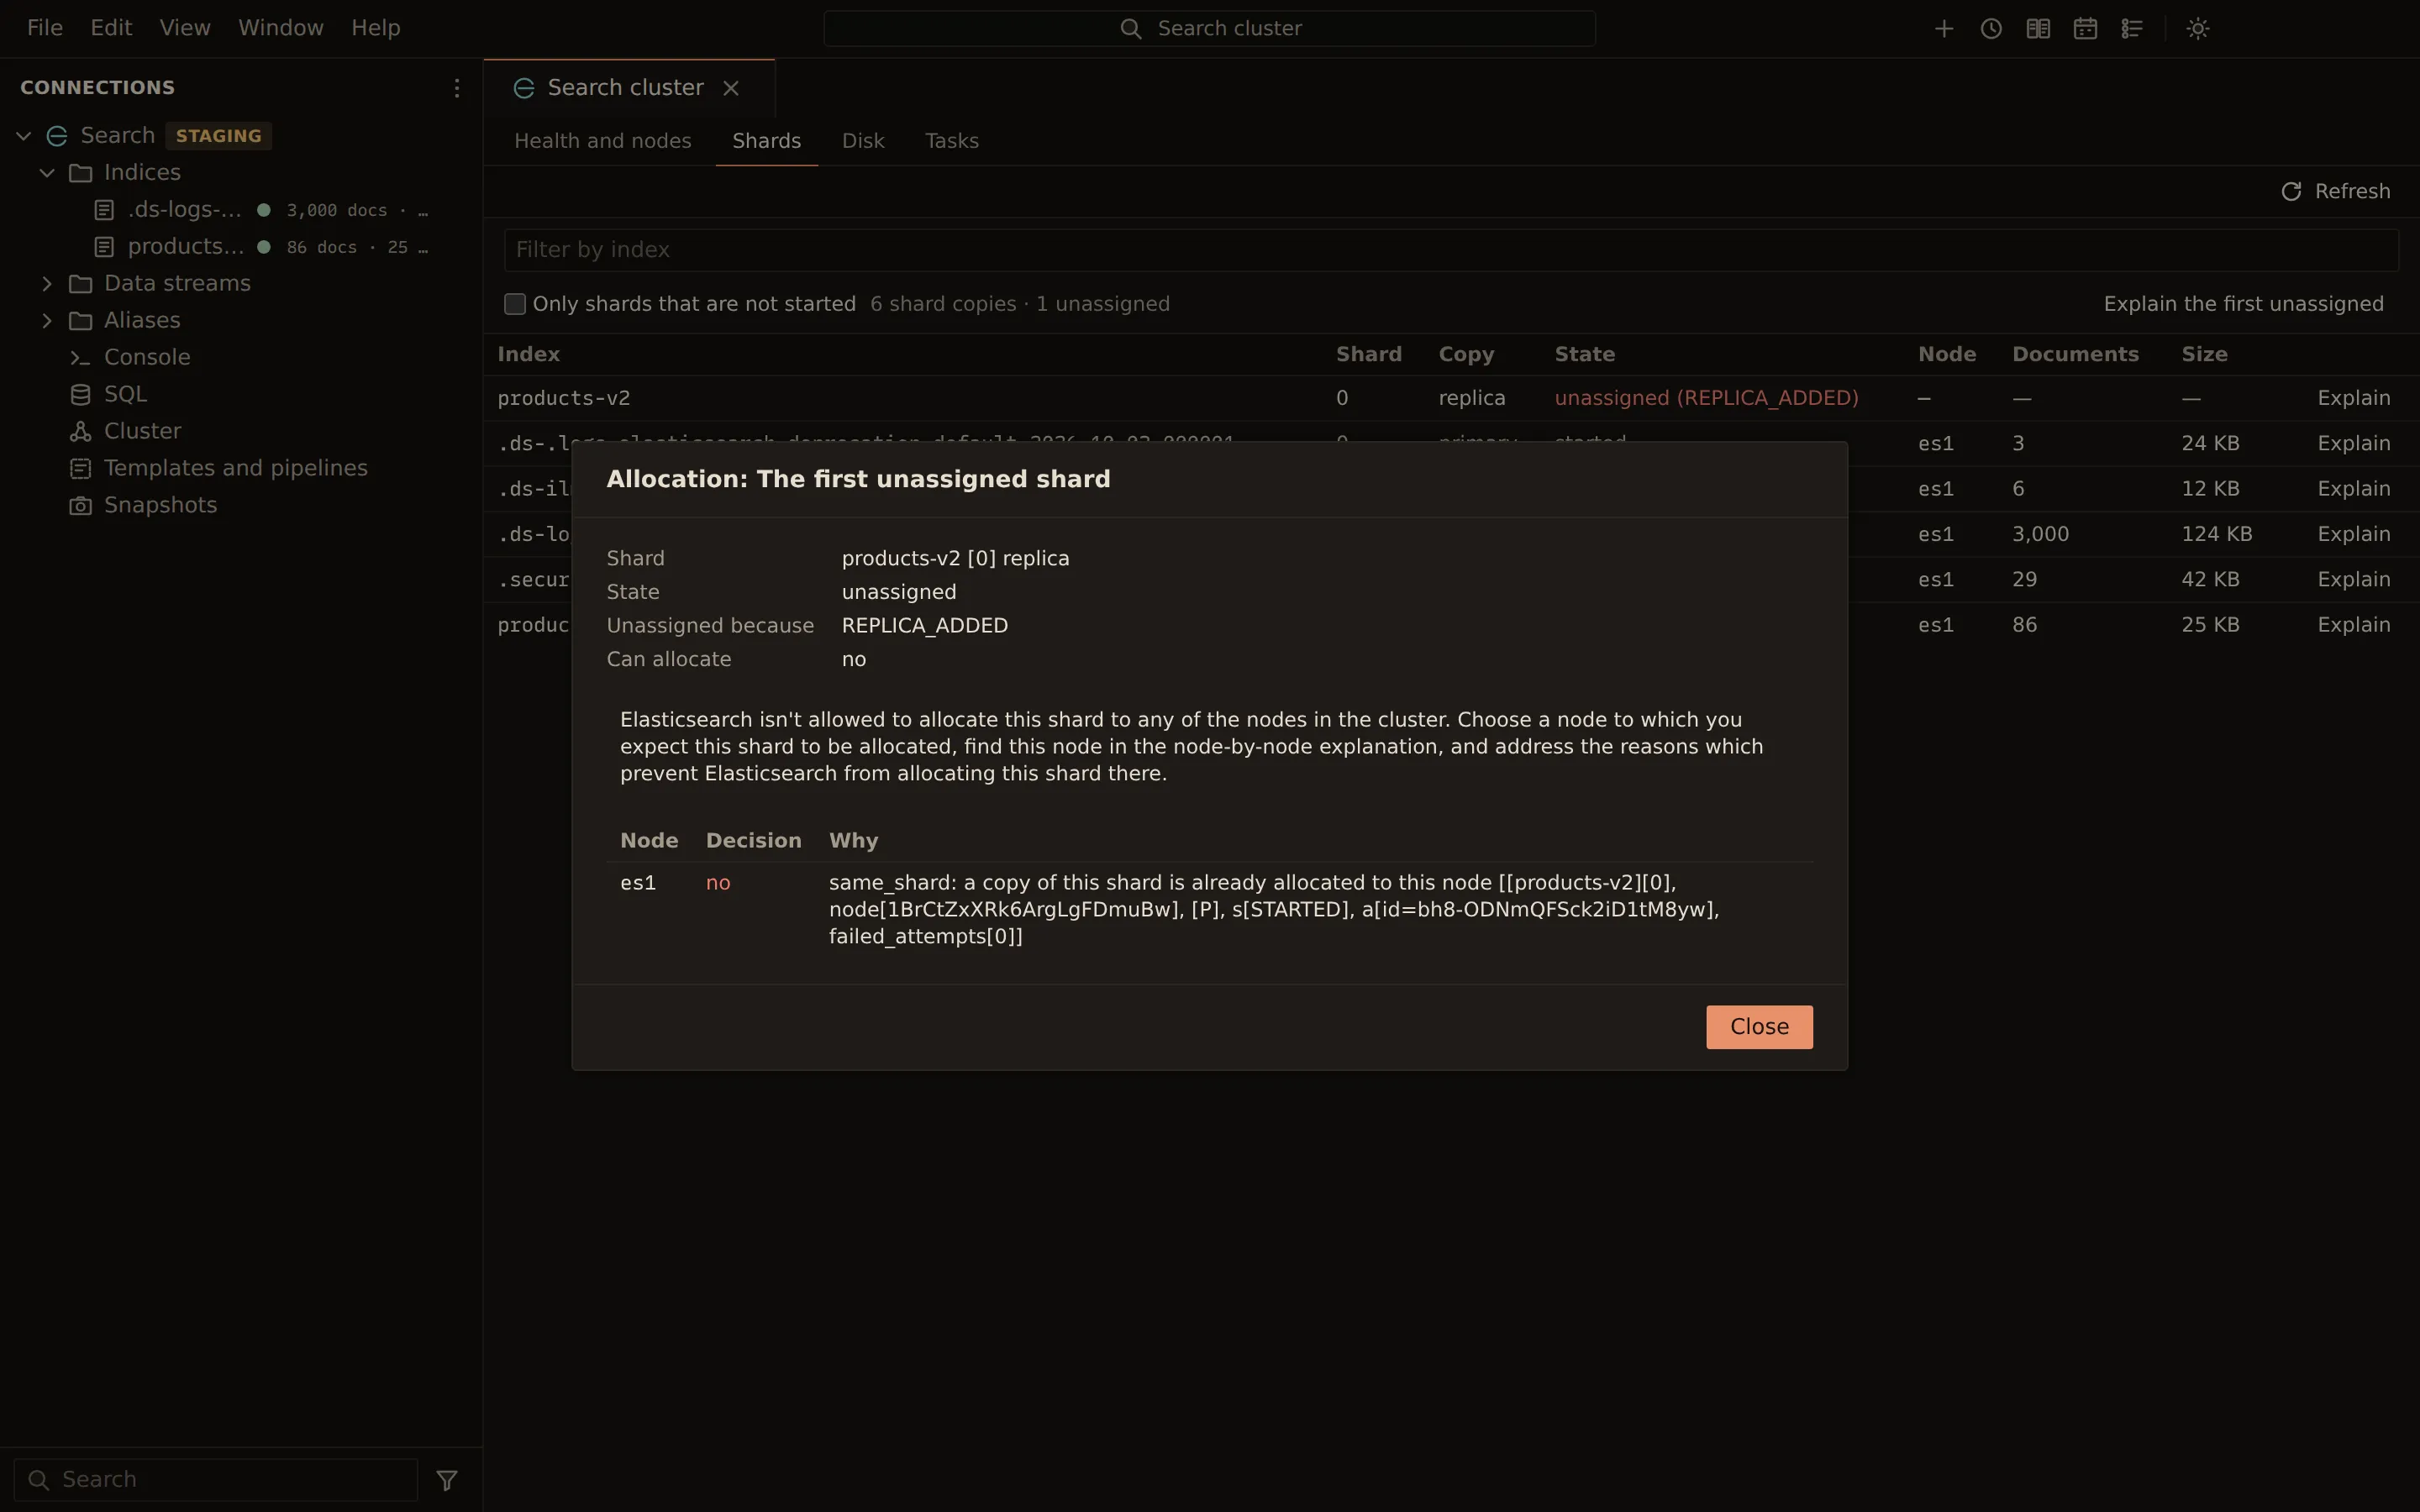
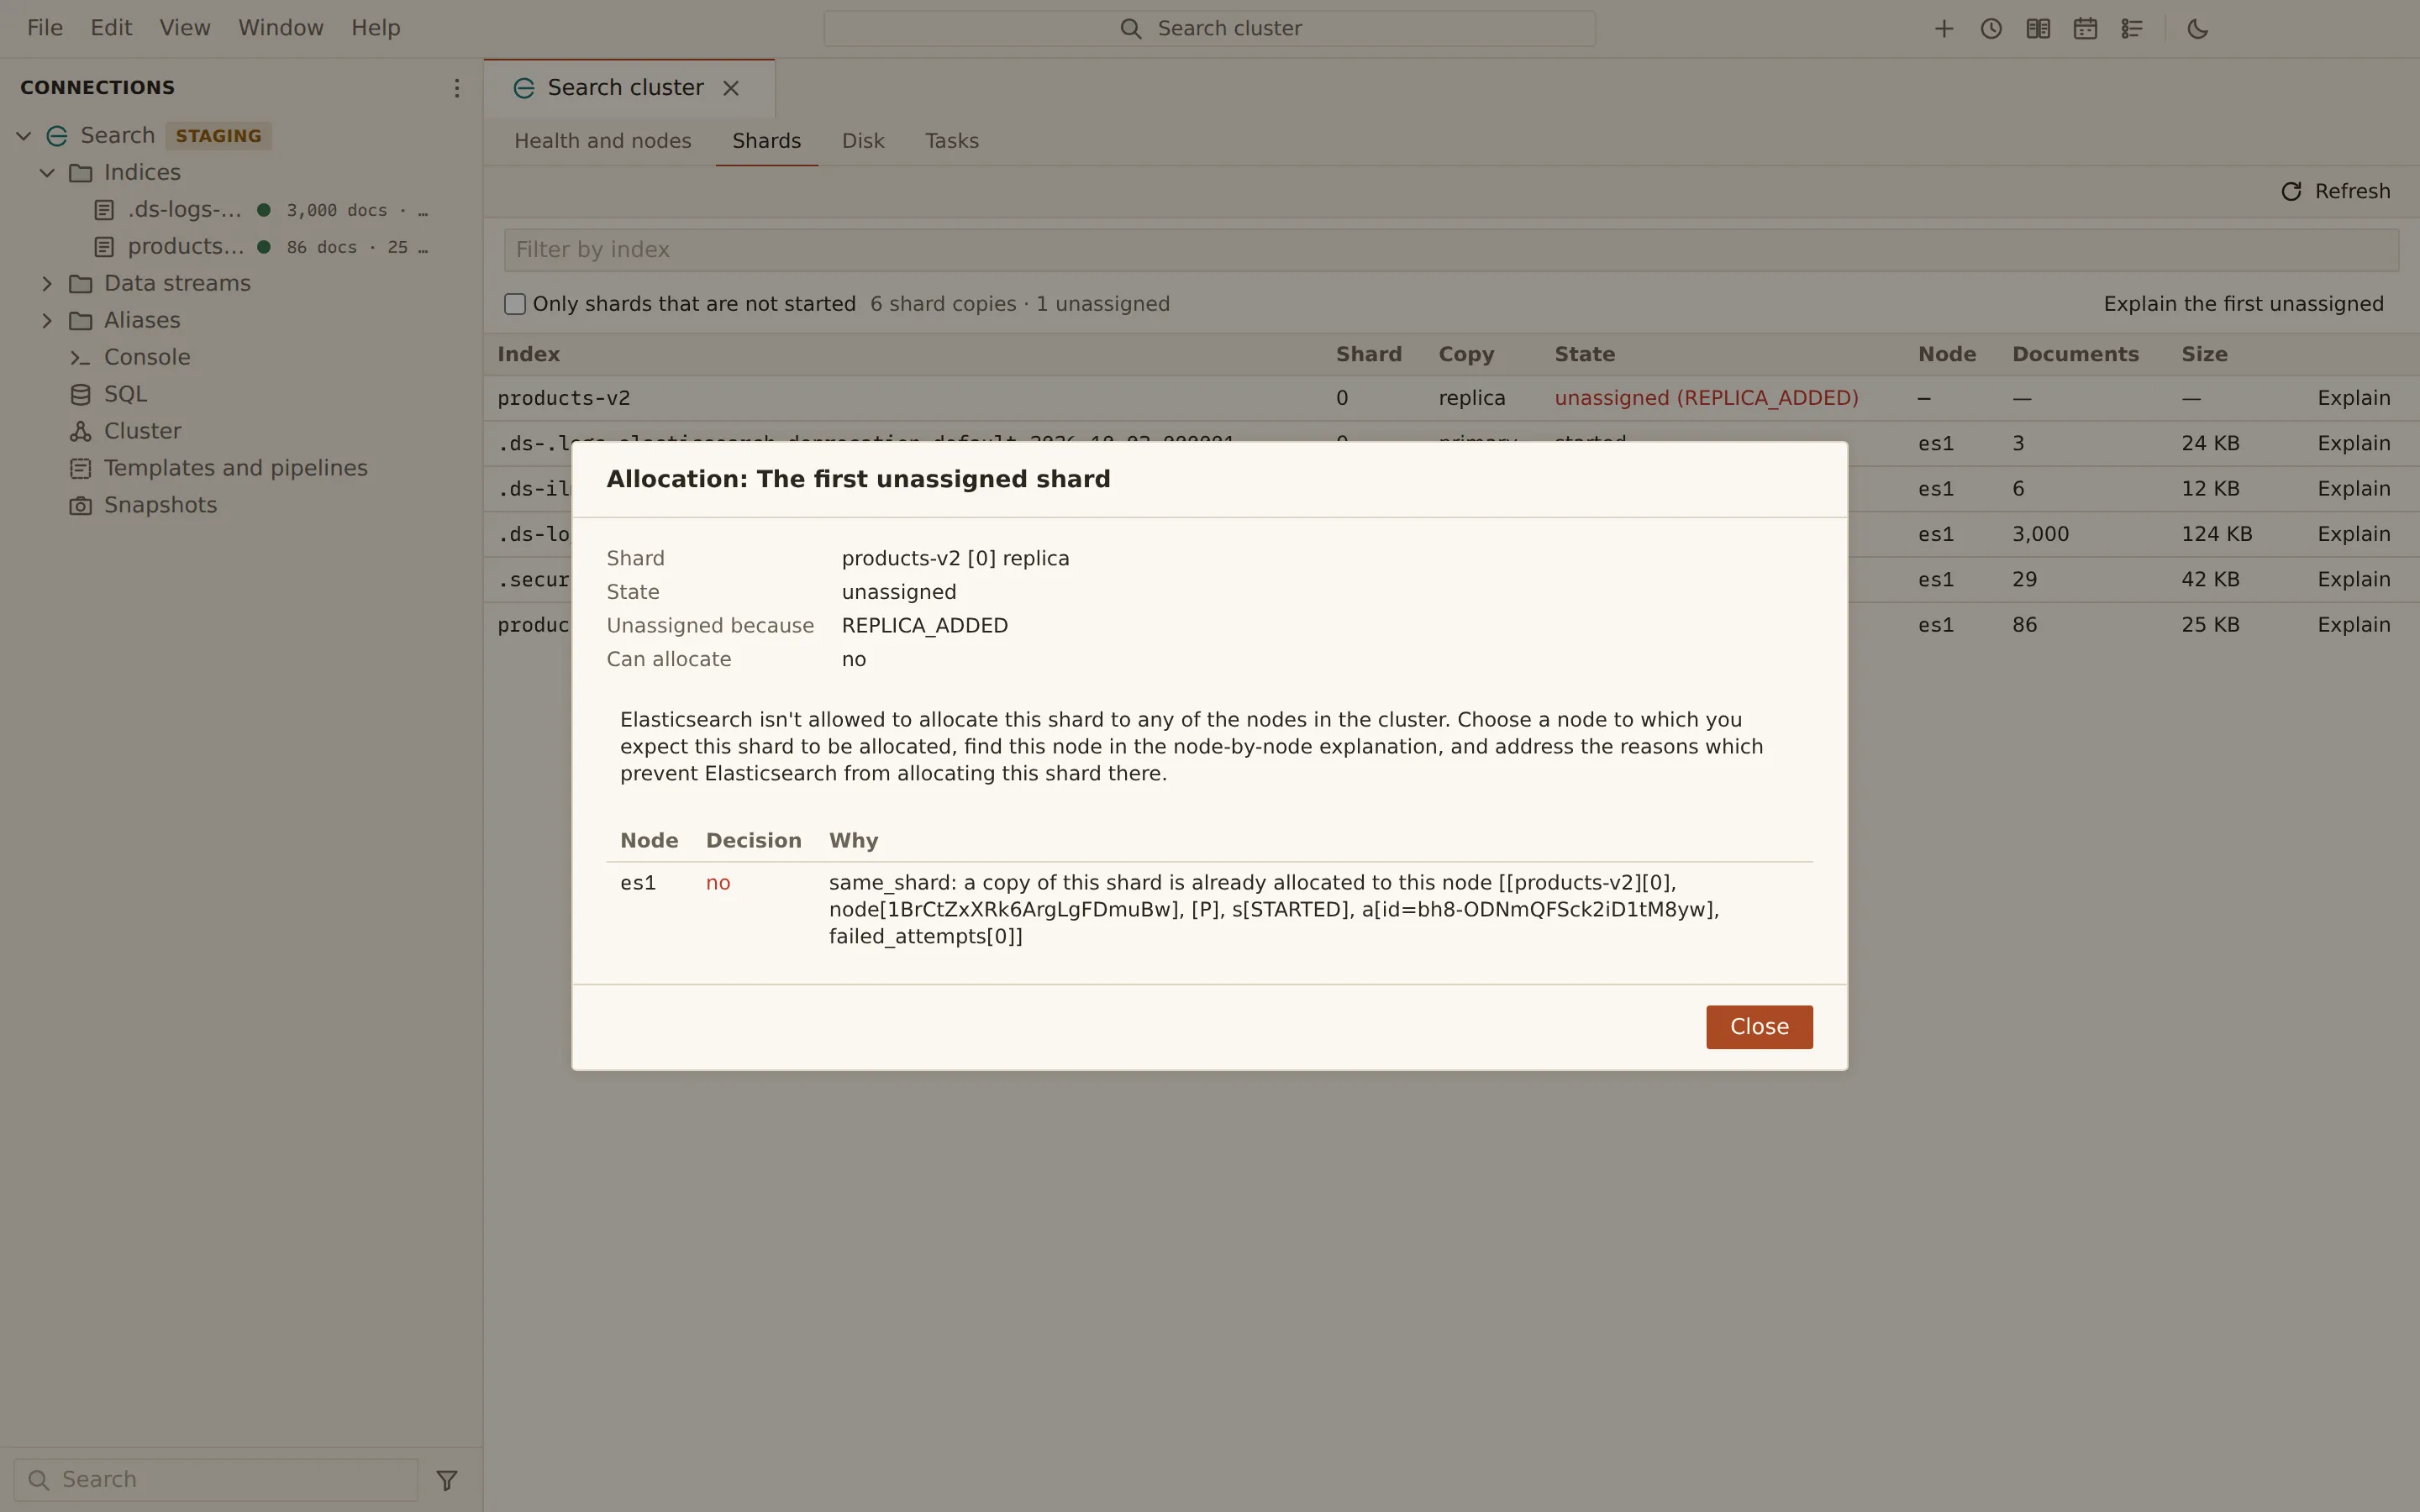
Section titled “Shards”The Shards tab lists every shard copy with its index, shard number, copy, state, node, documents and size. Unassigned shards come first.
- Filter by index narrows the list.
- Only shards that are not started hides the healthy ones.
- Explain on a row, or Explain the first unassigned, asks the cluster why a shard is where it is.
The explanation shows the shard’s state and node, why it is unassigned and the details, whether it can be allocated, and each node’s decision with the reason.
The Disk tab shows the disk watermarks as the cluster reads them, including a node’s own
elasticsearch.yml:
| Watermark | Meaning shown |
|---|---|
| Low (no new replicas above) | No new replicas go to a node above it |
| High (shards move away above) | Shards move off a node above it |
| Flood stage (indices turn read-only above) | Indices on the node turn read-only |
Where the cluster sets a headroom cap, it is shown beside the percentage (“95%, or once less than 100GB is free”). Threshold checks says whether the watermarks are enforced at all. The node disk table shows each node’s shards, used share, used and total, and free space, with the watermarks marked on the bars. Watermarks given as free space rather than percentages are listed but not drawn on the bars, since they depend on each disk’s size.
The Tasks tab lists running tasks with their id, action, running time, progress and description. Cancel… cancels a cancellable task. Production and confirm-writes profiles ask first; a read-only profile cannot cancel.
Related
Section titled “Related”Documents Querybara 0.1.1 · built frombc9f5aa