
ER diagrams
- PostgreSQL
- MySQL
- MariaDB
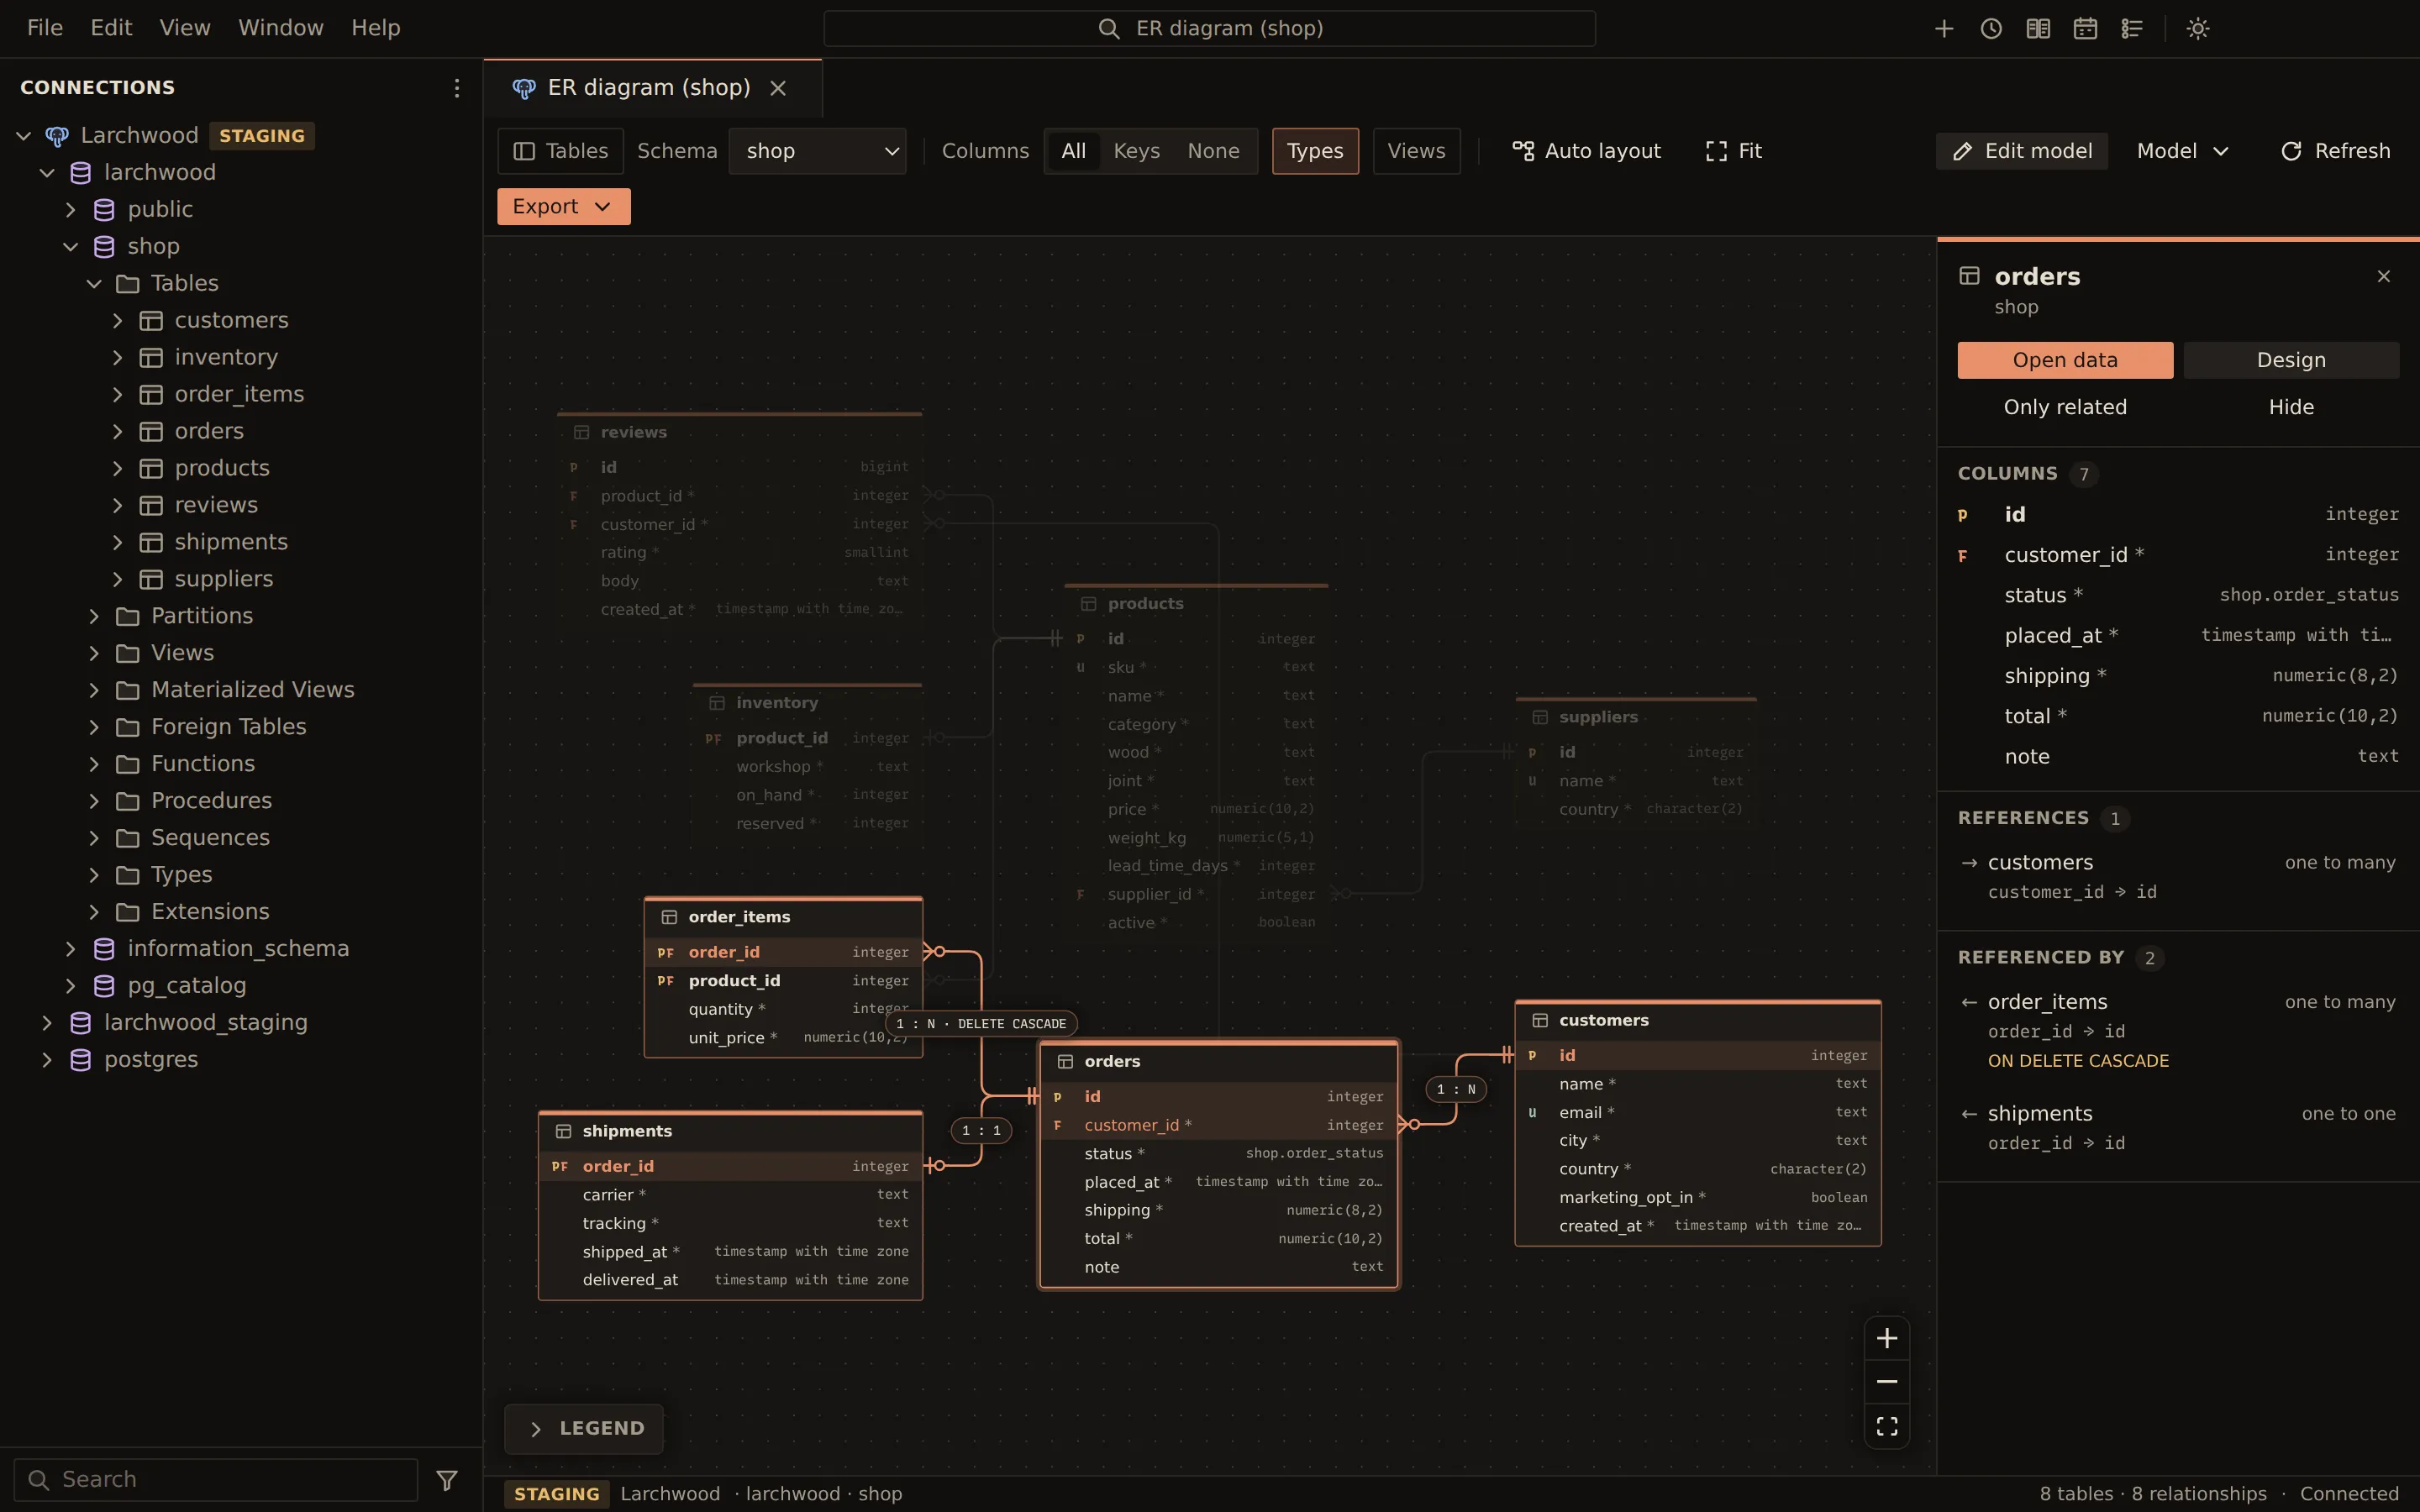
An ER diagram draws the tables of a database, or of one PostgreSQL schema, with their columns, keys and the relationships between them. Querybara reads the structure from the connection and lays the tables out for you. Use it to find your way around an unfamiliar schema, to see what a table is related to, or to export a picture for a document or review. To change the structure from the diagram, see ER model editing; to keep a model in a file, see Saved ER models.
Open a diagram
Section titled “Open a diagram”Right-click an open connection, a database or a PostgreSQL schema in the sidebar (or use its Actions button) and choose ER diagram. The diagram opens in its own tab. On PostgreSQL, the Schema picker in the toolbar switches between All schemas and one schema.
If the database or schema has unapplied model changes from an earlier session, the diagram opens in edit mode with them; see Saved ER models.
Read the diagram
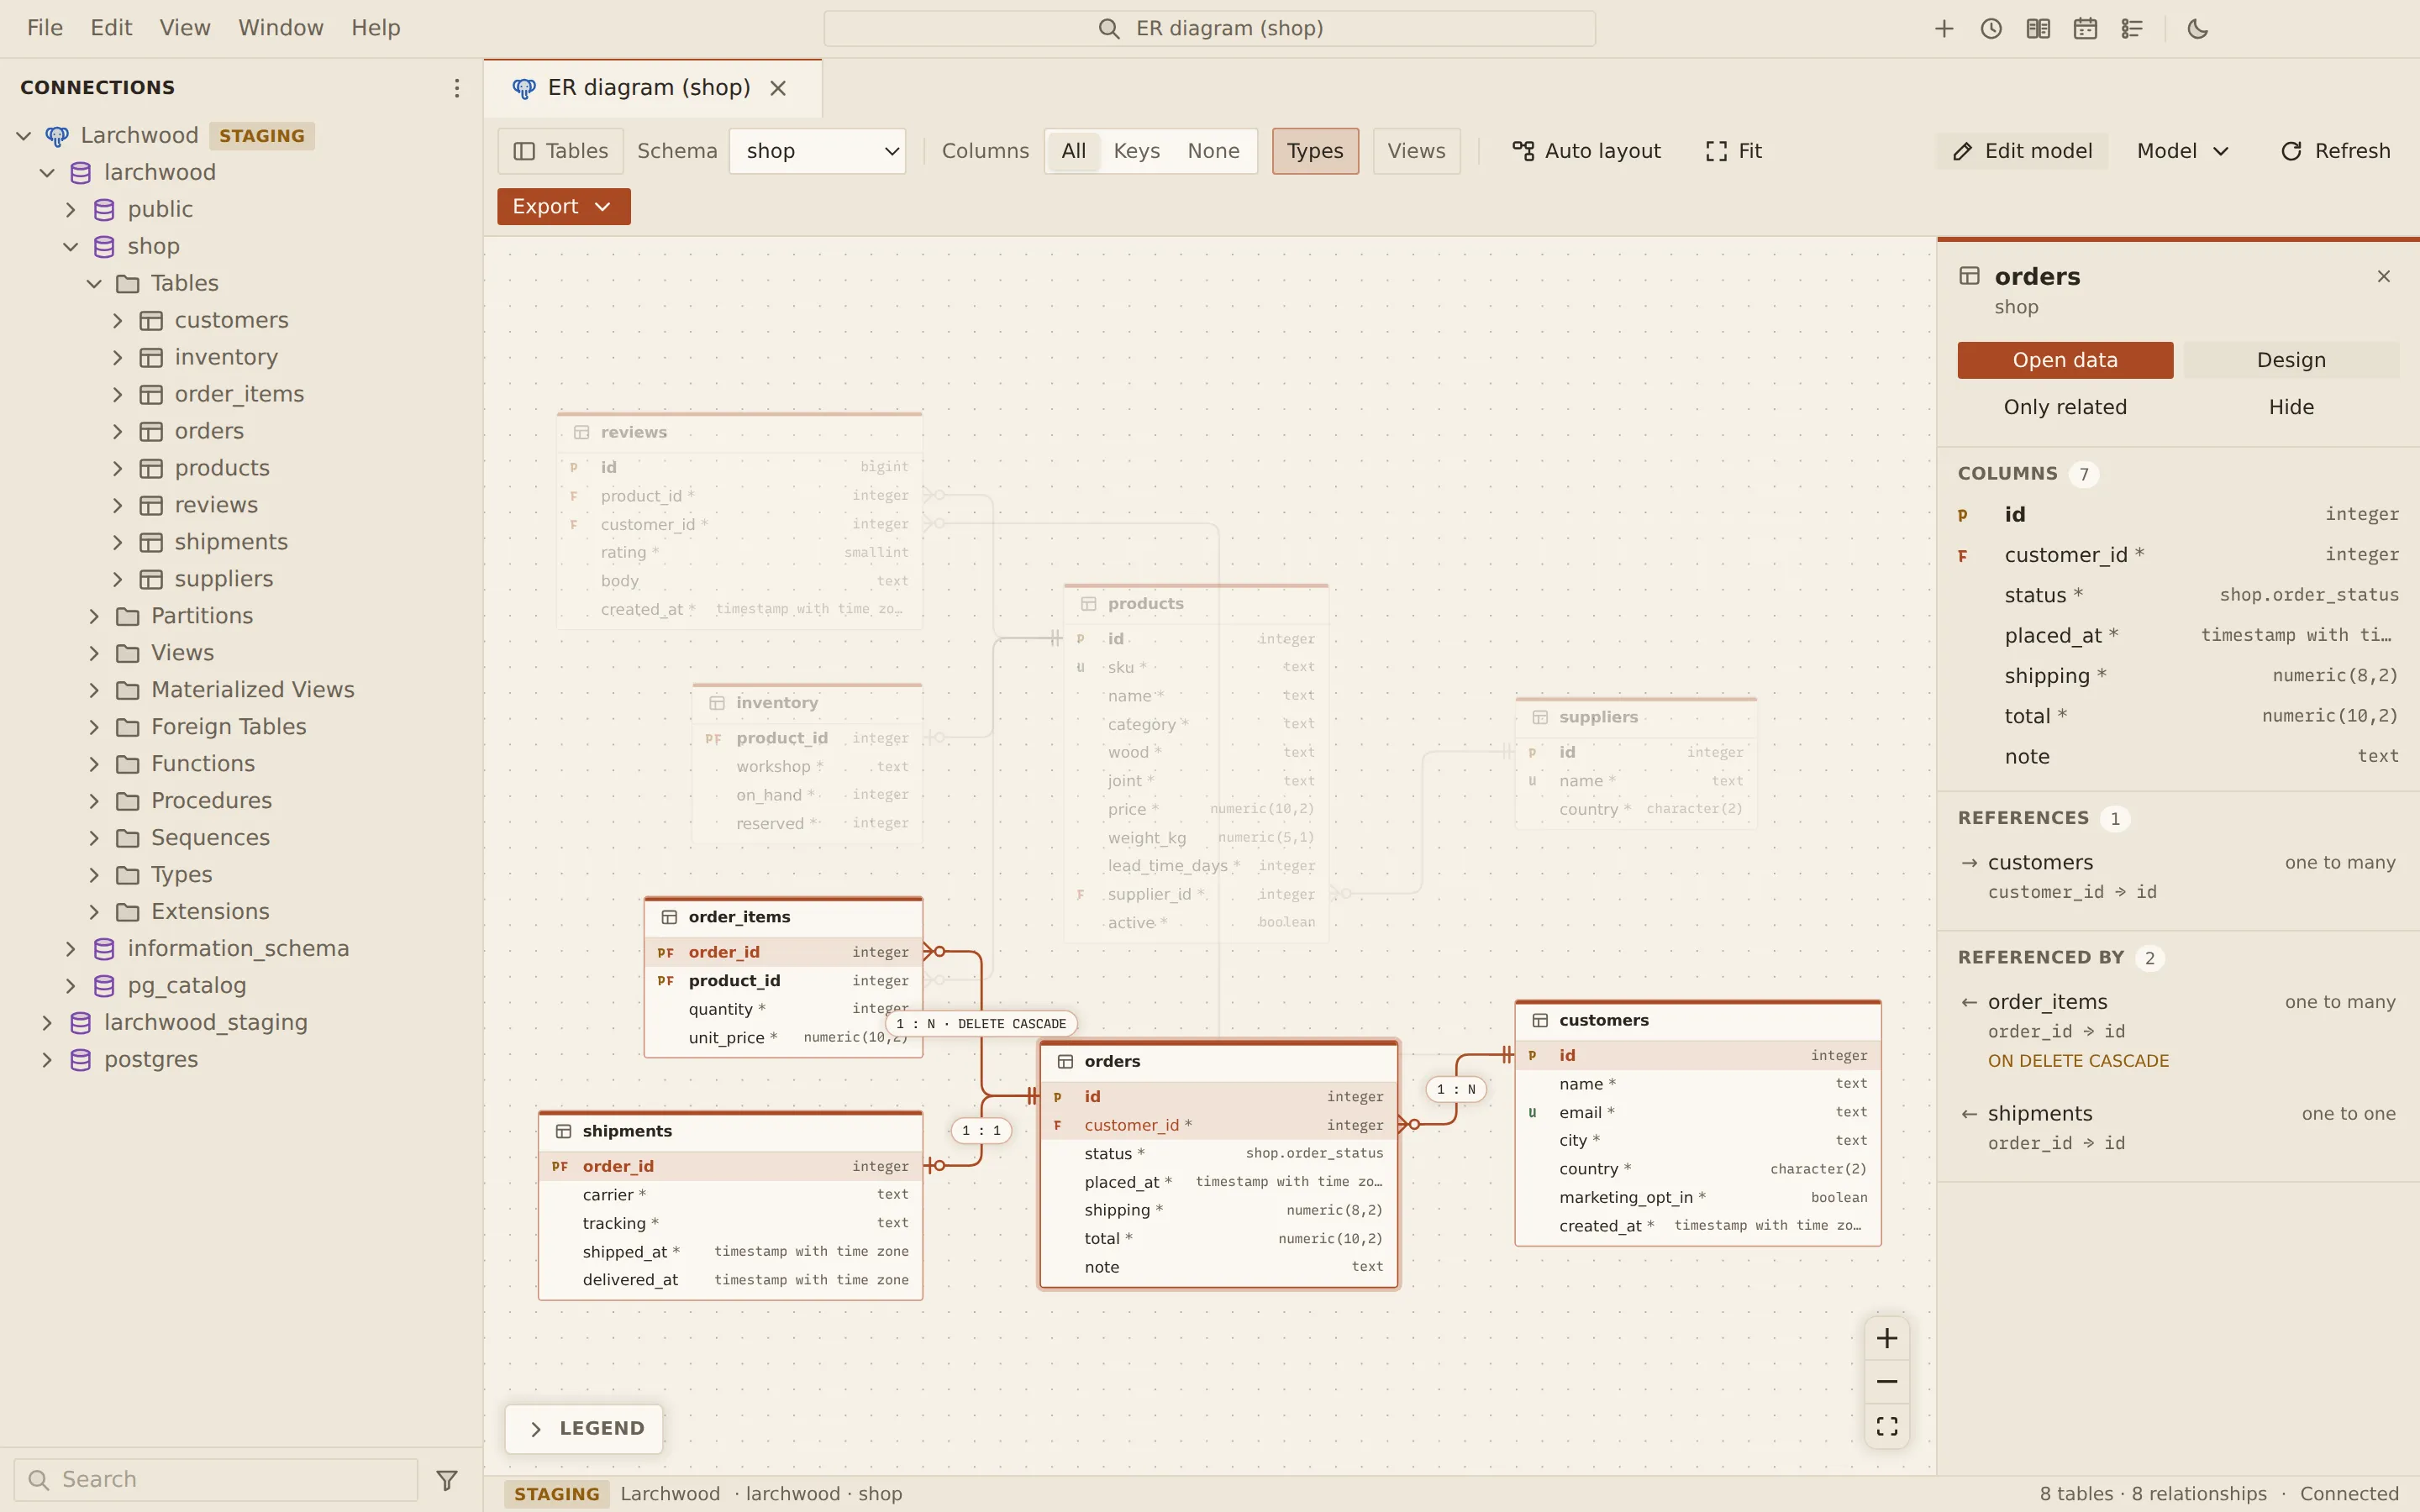
Section titled “Read the diagram”Each table is a box with its columns and their keys: P for primary key, F for foreign key, U for unique. Each foreign key is a line from the referencing column to the referenced column, with crow’s-foot ends:
- The referenced end is “exactly one” when every referencing column is
NOT NULL, and “zero or one” otherwise. - The referencing end is “zero or many”, or “zero or one” when its columns are the primary key or a unique key (one to one).
A foreign key that points outside the schema shown brings a stub of the referenced table, with only the referenced columns, drawn dashed. The canvas has a legend.
Arrange the diagram
Section titled “Arrange the diagram”| Control | What it does |
|---|---|
| Columns shown: All, Keys, None | Every column, key and relationship columns only, or table names only |
| Types | Show or hide the column types |
| Views | Add the views (and materialized views) to the diagram |
| Auto layout | Arrange the tables automatically, related tables side by side |
| Fit | Fit the whole diagram in view |
| Edit model | Change the structure on the canvas (ER model editing) |
| Model | Open model file… and Save as model file… (Saved ER models) |
| Refresh | Read the structure again from the server |
| Tables | Show or hide the list of tables |
Drag a box to move it. Your arrangement is kept when the diagram reloads, and tables that appear later are placed beside it. It lasts while the diagram tab is open; to keep it, save the diagram as a model file (Model → Save as model file…), which records where each box is.
Explore relationships
Section titled “Explore relationships”Click a table to select it. The diagram fades everything not related to it, and the details pane on the right shows its Columns, its References and what it is Referenced by. Each relationship there is a link to the other table. From the details you can also choose Open data, Design (the table designer), Only related and Hide.
Right-click a table on the canvas for Open data, Design table, Show only related tables, Hide from the diagram and Copy name.
Find, hide and show tables
Section titled “Find, hide and show tables”- Type in Find tables and columns (Ctrl + F, or Cmd + F on macOS) to filter the table list; matching boxes are ringed on the canvas. Esc clears the search, then the selection.
- Click a table in the list to bring it into view.
- Clear a table’s checkbox in the list to hide it. Show all brings every table back.
- Only related (or Show only related tables) leaves the table and the tables it is related to.
Export
Section titled “Export”Choose Export in the toolbar.
| Menu item | Result |
|---|---|
| SVG image… | A standalone SVG file |
| PNG image… | A PNG at twice the size |
| Mermaid diagram… | A .mmd file with a Mermaid erDiagram, for Markdown that renders it |
| As Mermaid | The Mermaid text on the clipboard |
| As SVG markup | The SVG on the clipboard |
The export is drawn from the diagram itself, not captured from the screen. It uses light colours, includes the whole diagram whatever the zoom, and leaves hidden tables out.
The Mermaid text has an entity per table with its columns, types and keys, and a line per foreign key with the same crow’s-foot ends as the canvas. An excerpt:
erDiagram customers ||--o{ orders : "orders_customer_id_fkey" customers { integer id PK text name }Related
Section titled “Related”Documents Querybara 0.1.1 · built frombc9f5aa