
Console
- Elasticsearch
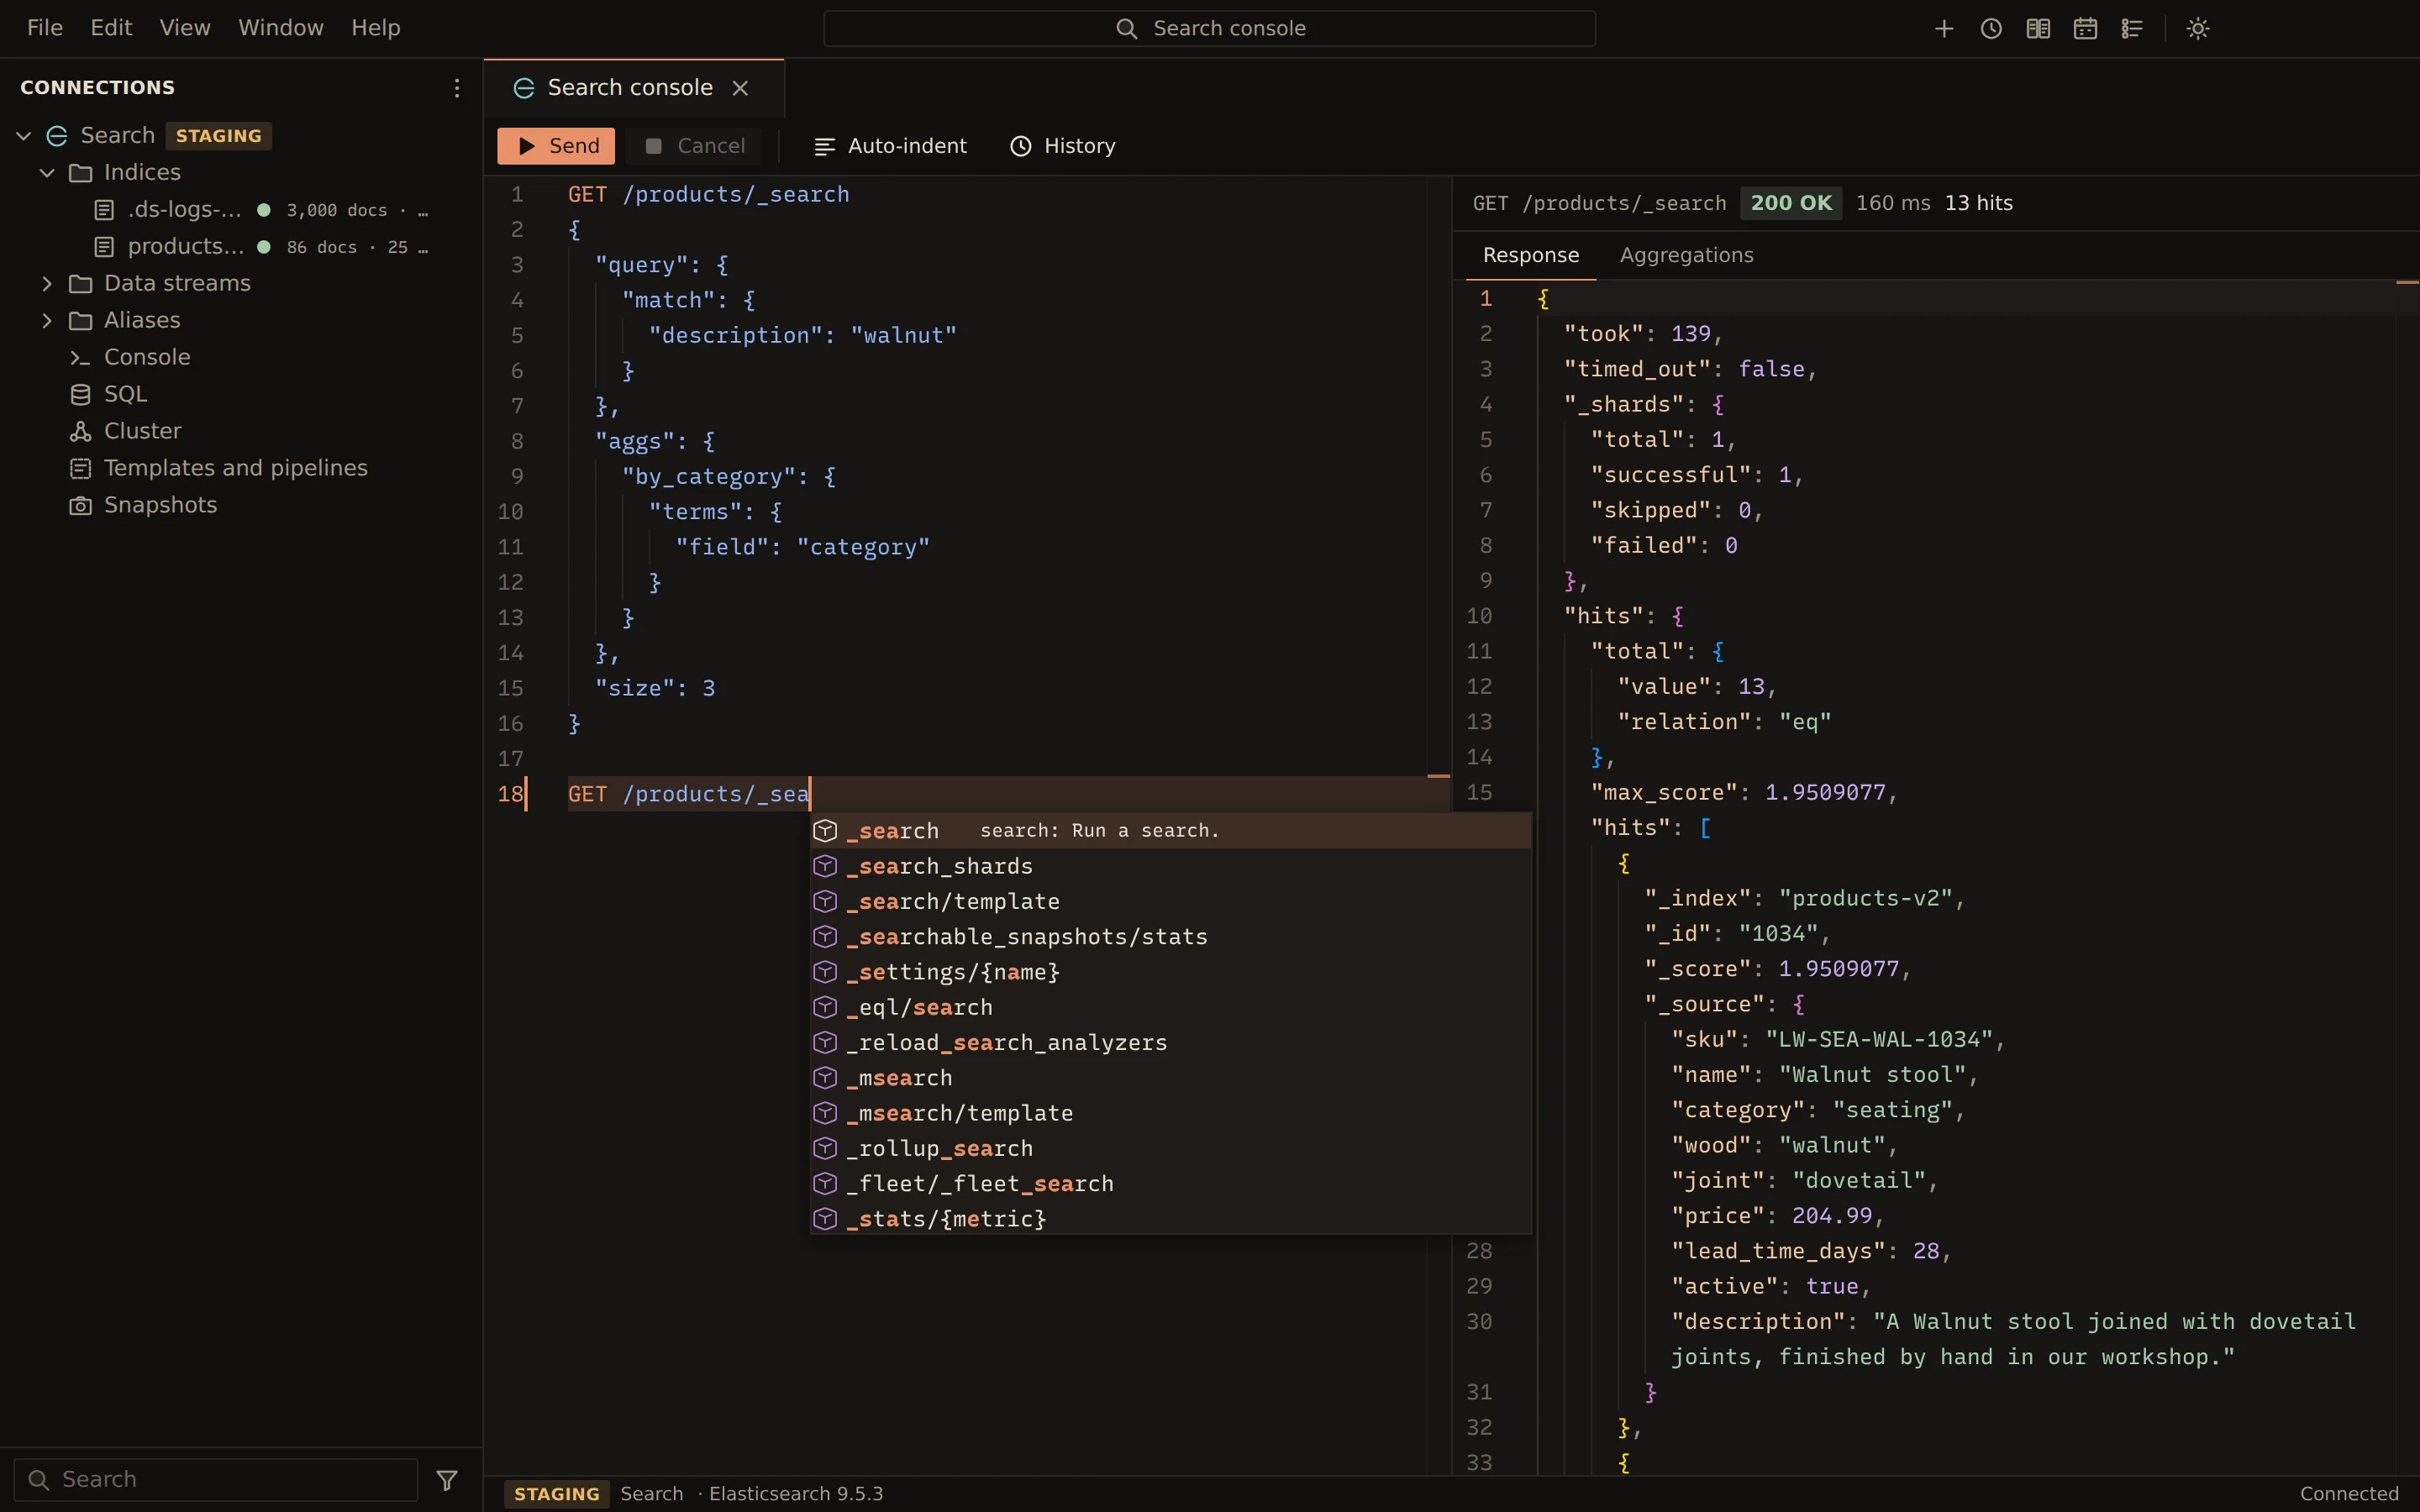
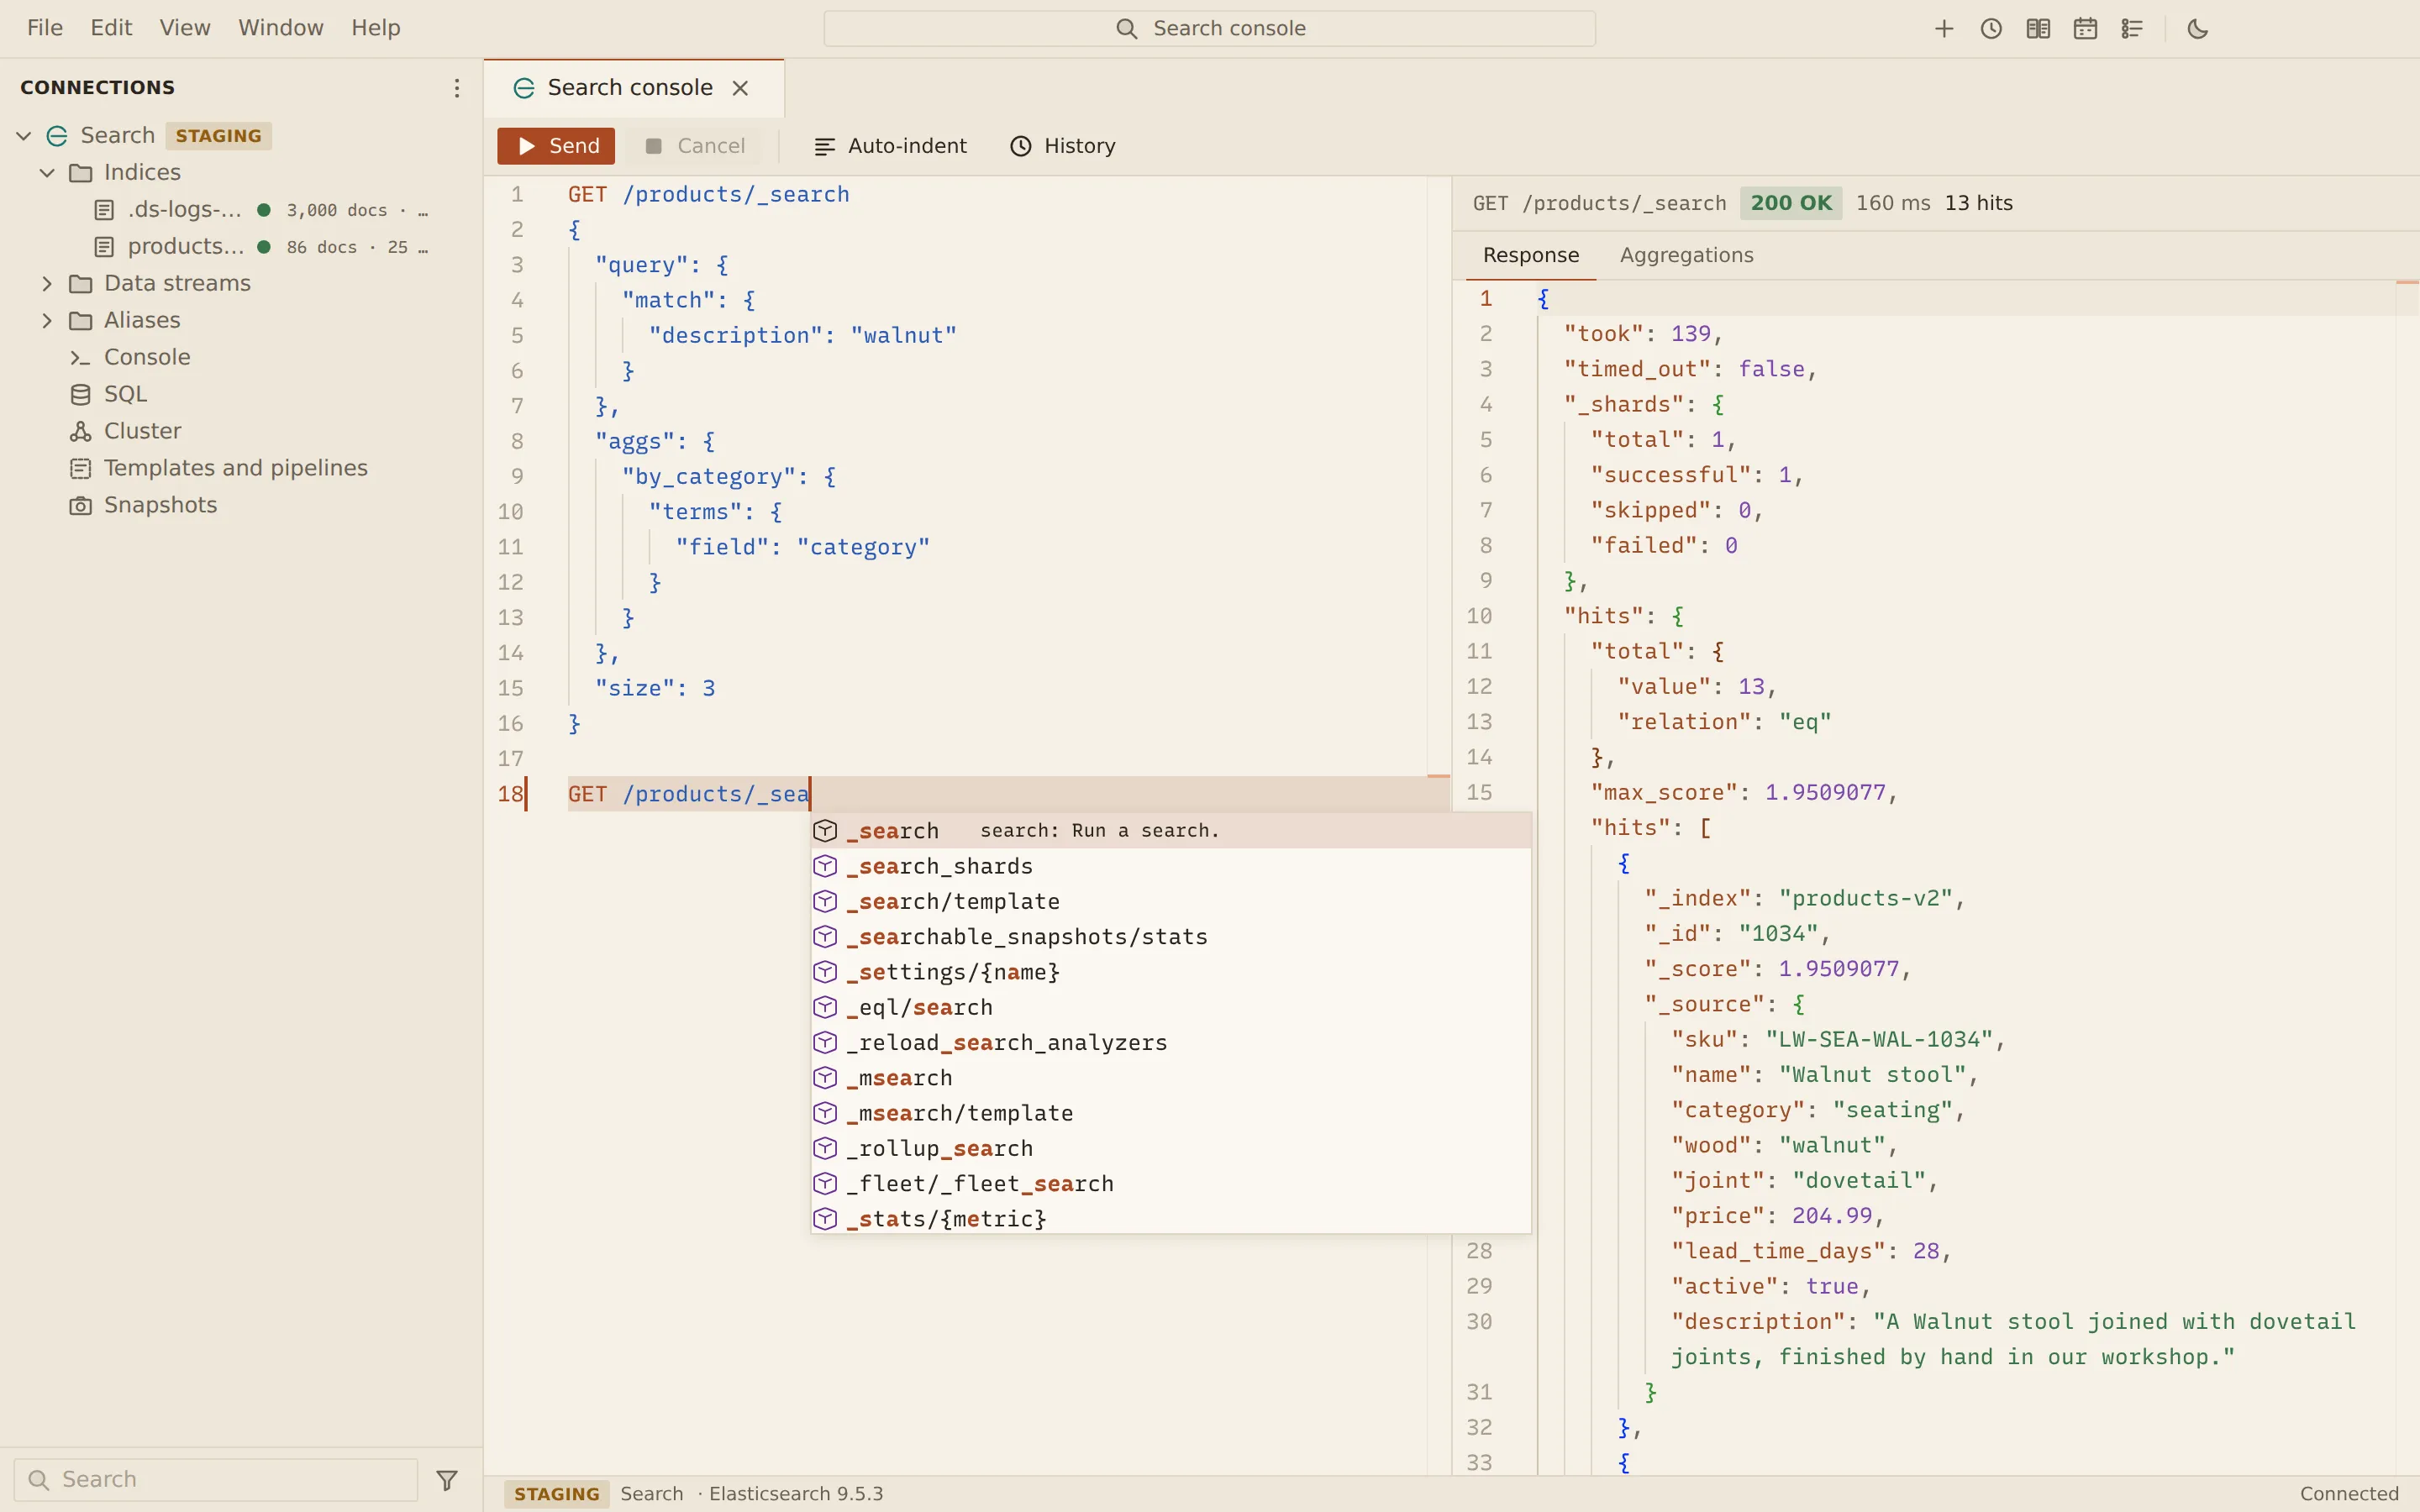
The console takes requests in Kibana Dev Tools syntax: a method and a path on one line, then an optional JSON body. Requests go on the left, responses show on the right. Use it for anything the other panels do not cover.
Send a request
Section titled “Send a request”-
Open the connection’s menu and choose Open console, or double-click Console in the sidebar.
-
Type a request, for example:
GET /orders/_search{"query": { "term": { "status": "paid" } }} -
Put the cursor in the request and choose Send, or press Ctrl + Enter (Cmd + Enter on macOS).
With text selected, Send runs every request the selection touches, in order; the response pane
then has one tab per request. _bulk and _msearch take NDJSON lines as their body.
Cancel stops a running request. Each request carries an X-Opaque-Id, so cancelling also
cancels the server tasks it started.
Autocomplete
Section titled “Autocomplete”Suggestions come from the open Elasticsearch API specification and follow what you are typing:
- methods at the start of a request line
- endpoint paths, and index, alias and data stream names, after the method
- query parameters after
? - the keys and allowed values of request bodies, following the JSON path at the cursor through queries, aggregations, mappings and settings
Toolbar
Section titled “Toolbar”| Button | What it does |
|---|---|
| Send | Sends the request at the cursor, or every request in the selection |
| Cancel | Stops the running request |
| Auto-indent | Re-indents the request bodies |
| History | Lists the requests sent from this console; click one to put it back in the editor |
Responses
Section titled “Responses”The response header shows the status, the time taken and a short summary. When a request cannot be parsed, or the server reports an error position, the editor marks the spot. A response with aggregations gets two tabs: Response for the JSON and Aggregations, which shows them as a Tree of aggregations, buckets with their document counts and metrics, or as a Table with one row per innermost bucket.
Responses keep numbers exactly as the server wrote them: a _source holding
1234567890123456789 or 1.10 shows unchanged.
Write rules
Section titled “Write rules”Requests that write follow the profile’s rules. A read-only profile refuses them. Destructive requests (deleting indices or documents, closing indices, delete by query, force merge, bulk requests with deletes) always ask first, and production and confirm-writes profiles ask before every write. The confirmation shows the request text and Send sends it.
The query builder of the documents view writes Query DSL for you; its Request tab has Open in console to continue with the search here.
From the command line
Section titled “From the command line”querybara query runs console text against an Elasticsearch URL or profile and prints each
response body. --format json or jsonl prints objects with the request, status and body.
querybara query search-prod -f requests.txt --format jsonlRelated
Section titled “Related”Documents Querybara 0.1.1 · built frombc9f5aa