
Collection view and query bar
- MongoDB
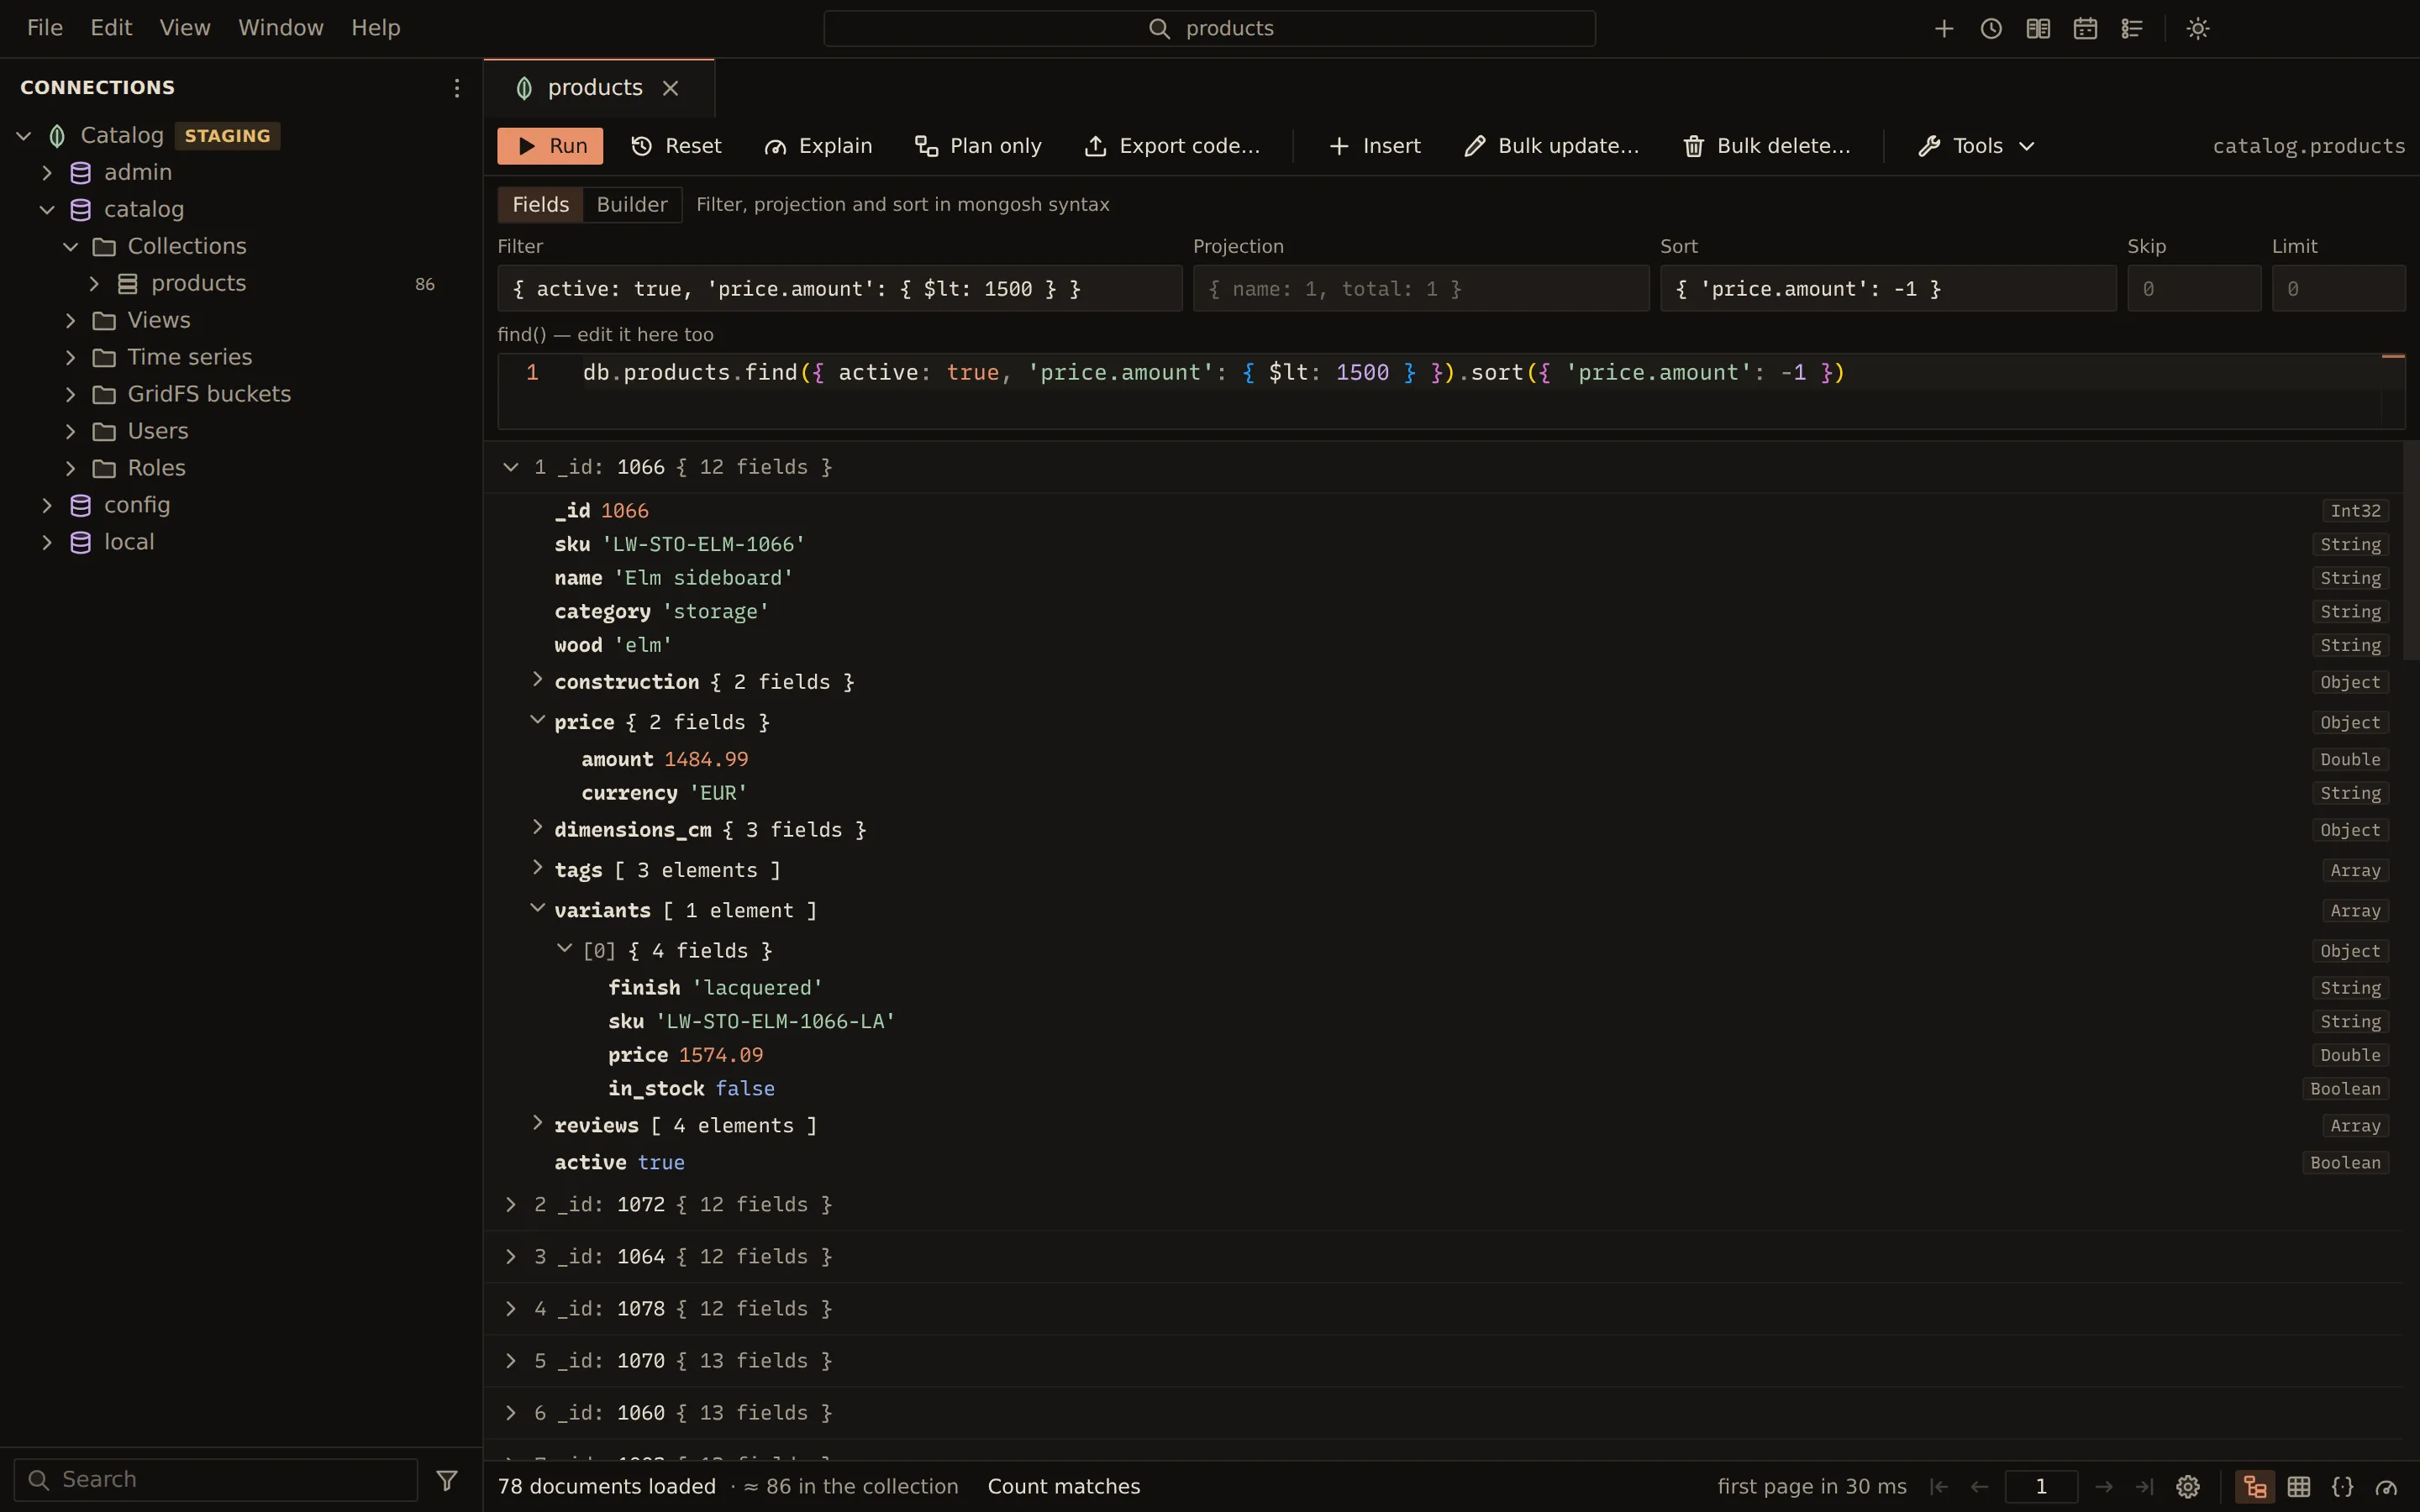
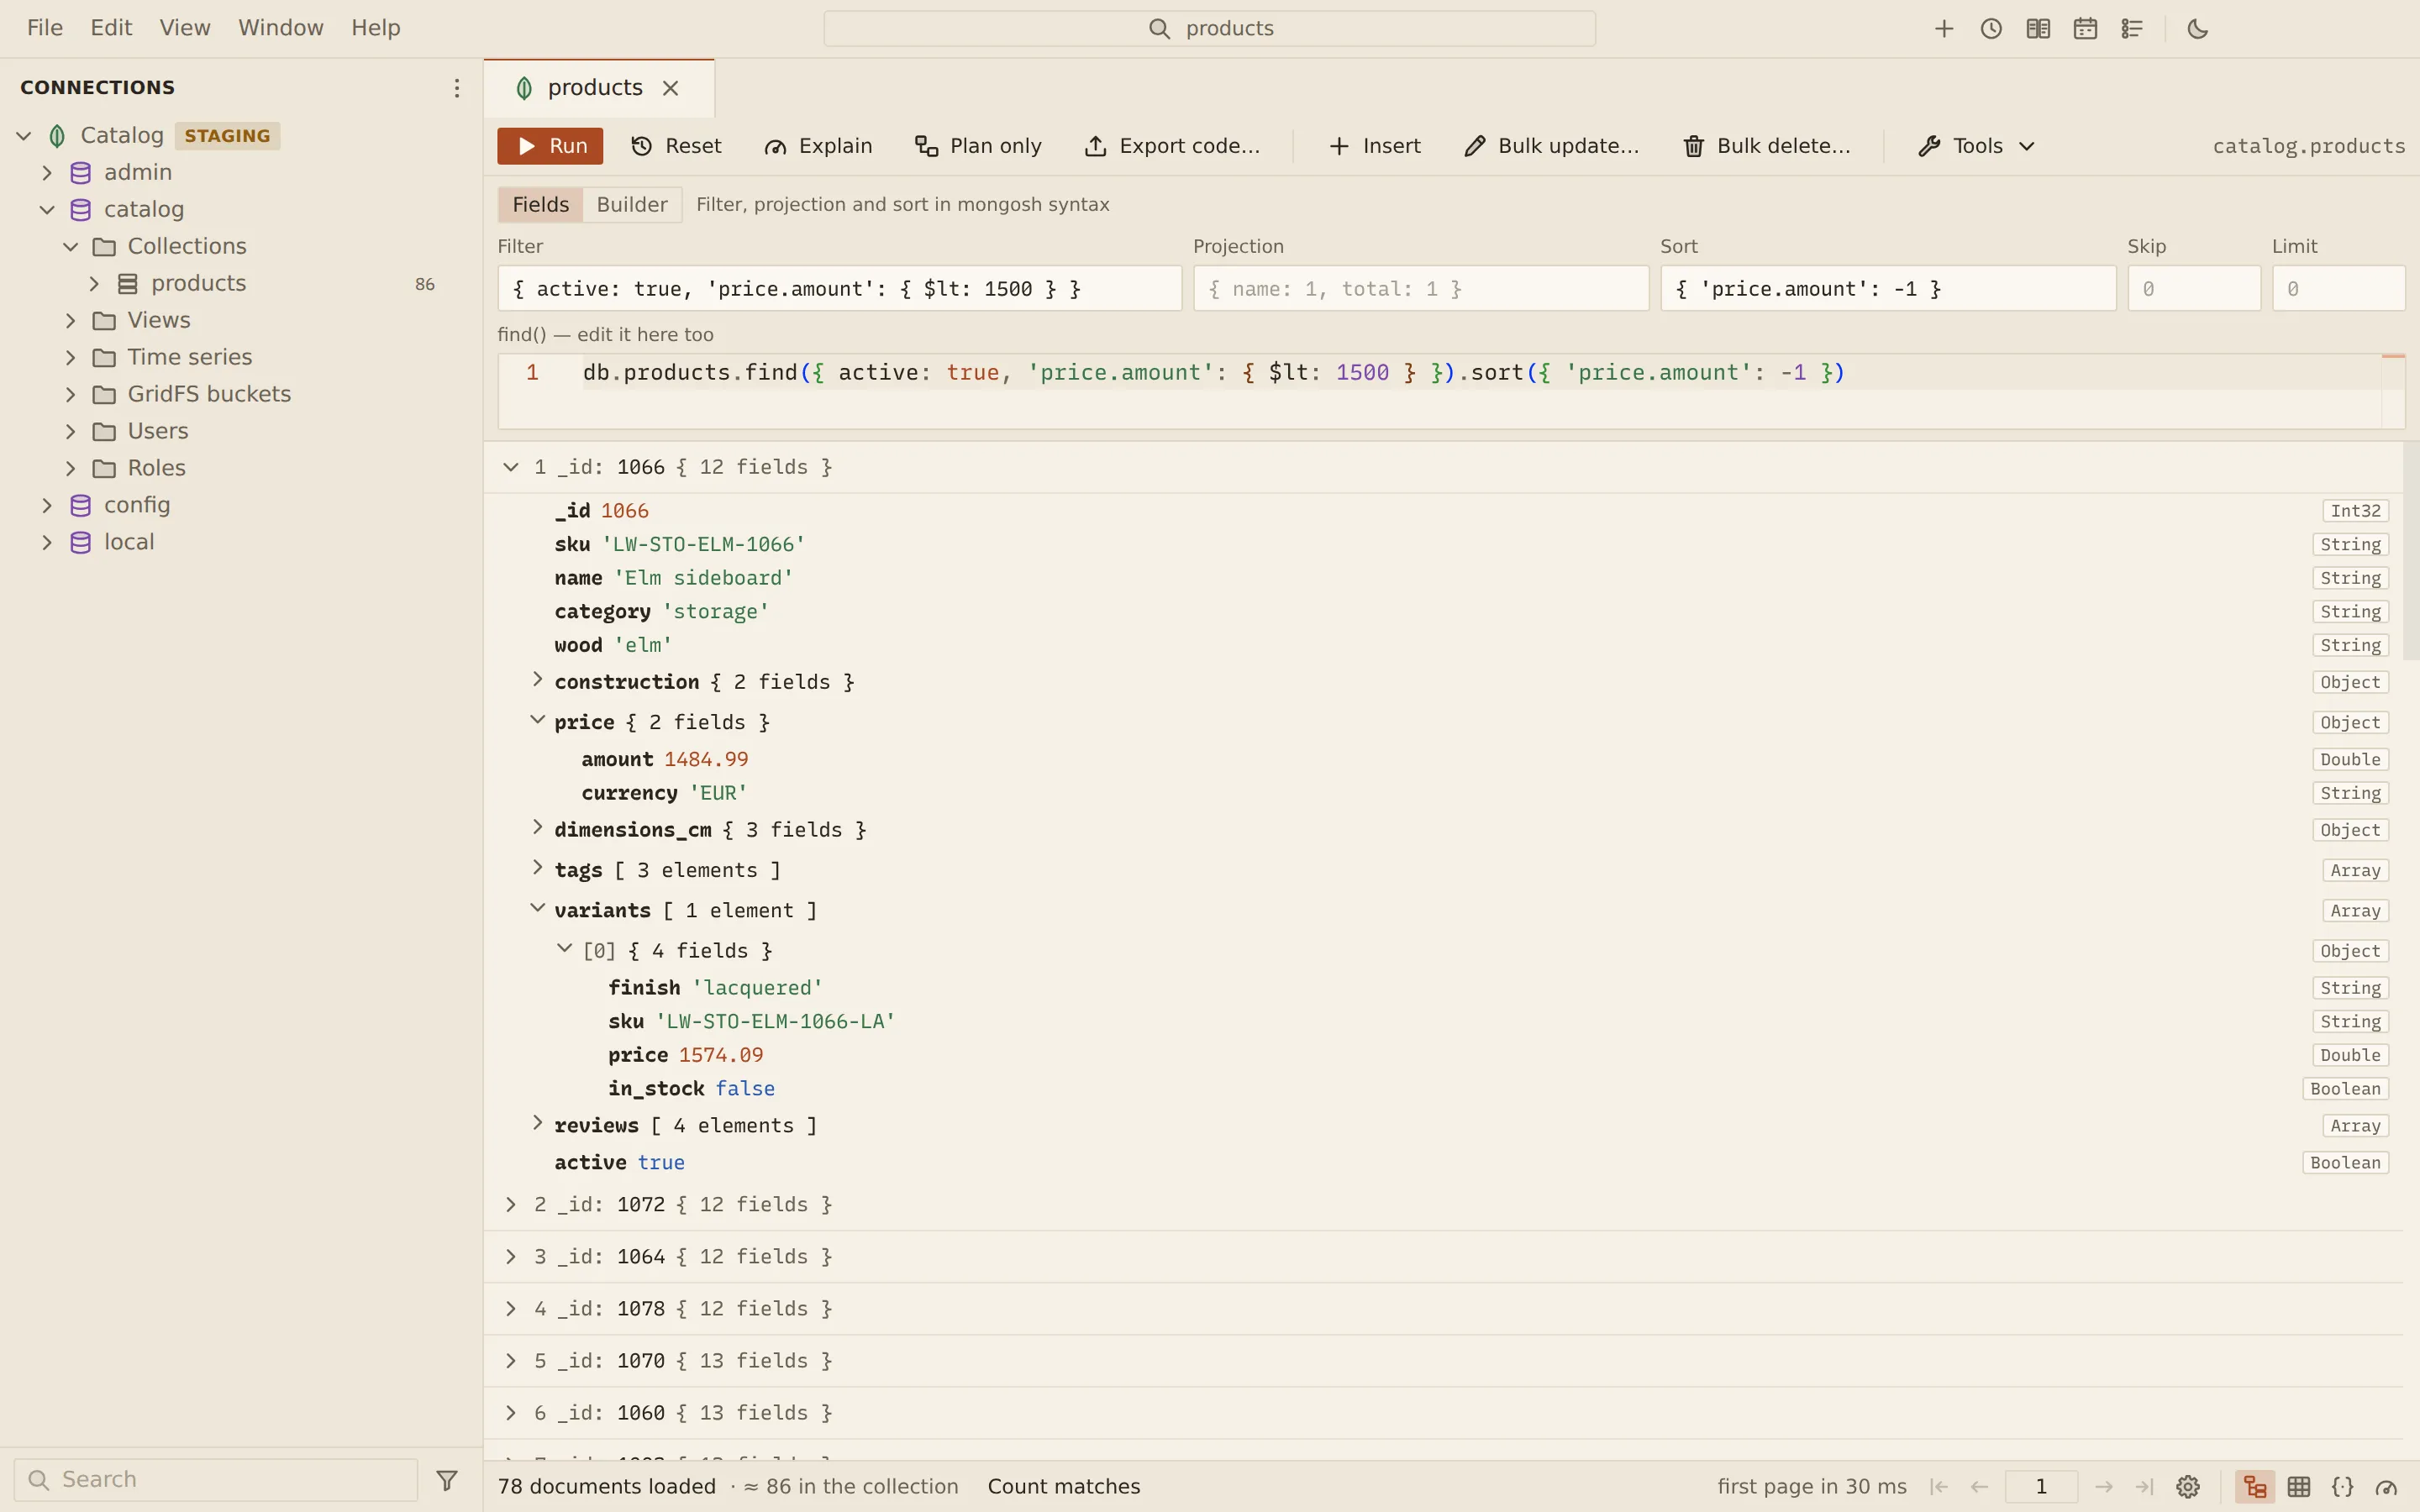
The collection view shows the documents of a collection, view or time series collection. You type
the filter, projection and sort in mongosh syntax, or build them in the
visual query builder, and the generated find() text stays in step
with both. The documents show a page at a time, as a tree, a table or JSON.
Open a collection
Section titled “Open a collection”Click a collection, view or time series collection in the explorer, or choose Open documents from its menu. You can also press Ctrl + P (Cmd + P on macOS) and type a few letters of its name. The first page of documents loads at once. If the collection is already open, its tab comes forward.
Query the documents
Section titled “Query the documents”- Leave the Query editor switch on Fields.
- Type into Filter, Projection and Sort in mongosh syntax, for example
{ category: 'chairs', price: { $gt: 100 } }, and set Skip and Limit if you need them. - Press Enter in any field, or choose Run in the toolbar.
The text under the fields, find() — edit it here too, shows the query as a find() call:
db.products.find({ category: 'chairs', price: { $gt: 100 } }).sort({ price: -1 }).limit(20)You can edit that text directly. The fields follow it, and Ctrl + Enter (Cmd + Enter on macOS) runs it.
A syntax error is shown under the field it is in, with its column; select the message to put the cursor there. Nothing runs until the query parses.
Reset clears the query.
Views of the results
Section titled “Views of the results”Pick a view with the Tree, Table, JSON and Explain icons at the right end of the status bar.
| View | What it shows |
|---|---|
| Tree | One row per document with its number and _id. Expand a document, or any sub-document or array in it, to see each field with its BSON type. |
| Table | One column per field, each with its BSON type. An array or sub-document cell is a link: select it to show its contents as a table. The breadcrumb above the table leads back. Nested fields as columns spreads sub-document fields into columns. |
| JSON | The documents as text, in mongosh syntax or as Relaxed EJSON. Copy puts the text on the clipboard. |
| Explain | The query plan. See Explain. |
In the table, drilling into an array of documents such as variants shows one row per element,
and you can keep drilling into nested arrays (for example variants › [0] › tags). Choose
Documents in the breadcrumb to return to the whole collection.
Pages and counts
Section titled “Pages and counts”The view shows one page of documents at a time: 100 by default. The pager in the status bar has First page, Previous page, the page number, Next page and Last page. Type a page number and press Enter to go to it. Documents are numbered on from the pages before, so the first document of page 2 is 101.
To change how many documents a page holds, open Page size (the gear beside the pager) and pick 50, 100, 500 or 1,000. The size you pick applies to every collection, and the view starts again at page 1.
Pages stay inside the query’s own Skip and Limit; a Limit of 0 means no limit.
The status bar shows how many documents the page holds and an estimate of the collection’s size. With a filter, choose Count matches for the exact number of matching documents; without one, Count exactly counts the whole collection. Counting… Cancel stops a count. Once the total is known, the pager shows the number of pages. Last page counts first when the total is not known yet. The status bar also shows how long the first page took.
Edit from the view
Section titled “Edit from the view”Hover a document to show its Edit, Clone and Delete buttons, and use Insert, Bulk update… and Bulk delete… in the toolbar. See Documents.
Some views of the data cannot be edited:
- A view is read-only: its documents come from a pipeline.
- A read-only connection shows the documents but does not change them.
- With a projection, Edit and Clone are hidden; clear the projection to edit whole documents.
Other tools from the toolbar
Section titled “Other tools from the toolbar”| Button | Opens |
|---|---|
| Explain | The plan with execution statistics. Plan only shows the chosen plan without running the query. |
| Export code… | The query as a program. See Export query as code. |
The other tools sit under Tools, each with a line on what it does:
| Tools menu item | Opens |
|---|---|
| Aggregate | The aggregation editor, starting with the current filter as a $match. |
| SQL | A SQL tab on the collection. |
| Indexes | The index manager. Not offered for a view. |
| Schema | Schema analysis. |
| Options | Collection options. |
| Watch | A change stream on the collection. Not offered for a view. |
Related
Section titled “Related”Documents Querybara 0.1.1 · built frombc9f5aa