
Monitor
- PostgreSQL
- MySQL
- MariaDB
- MongoDB
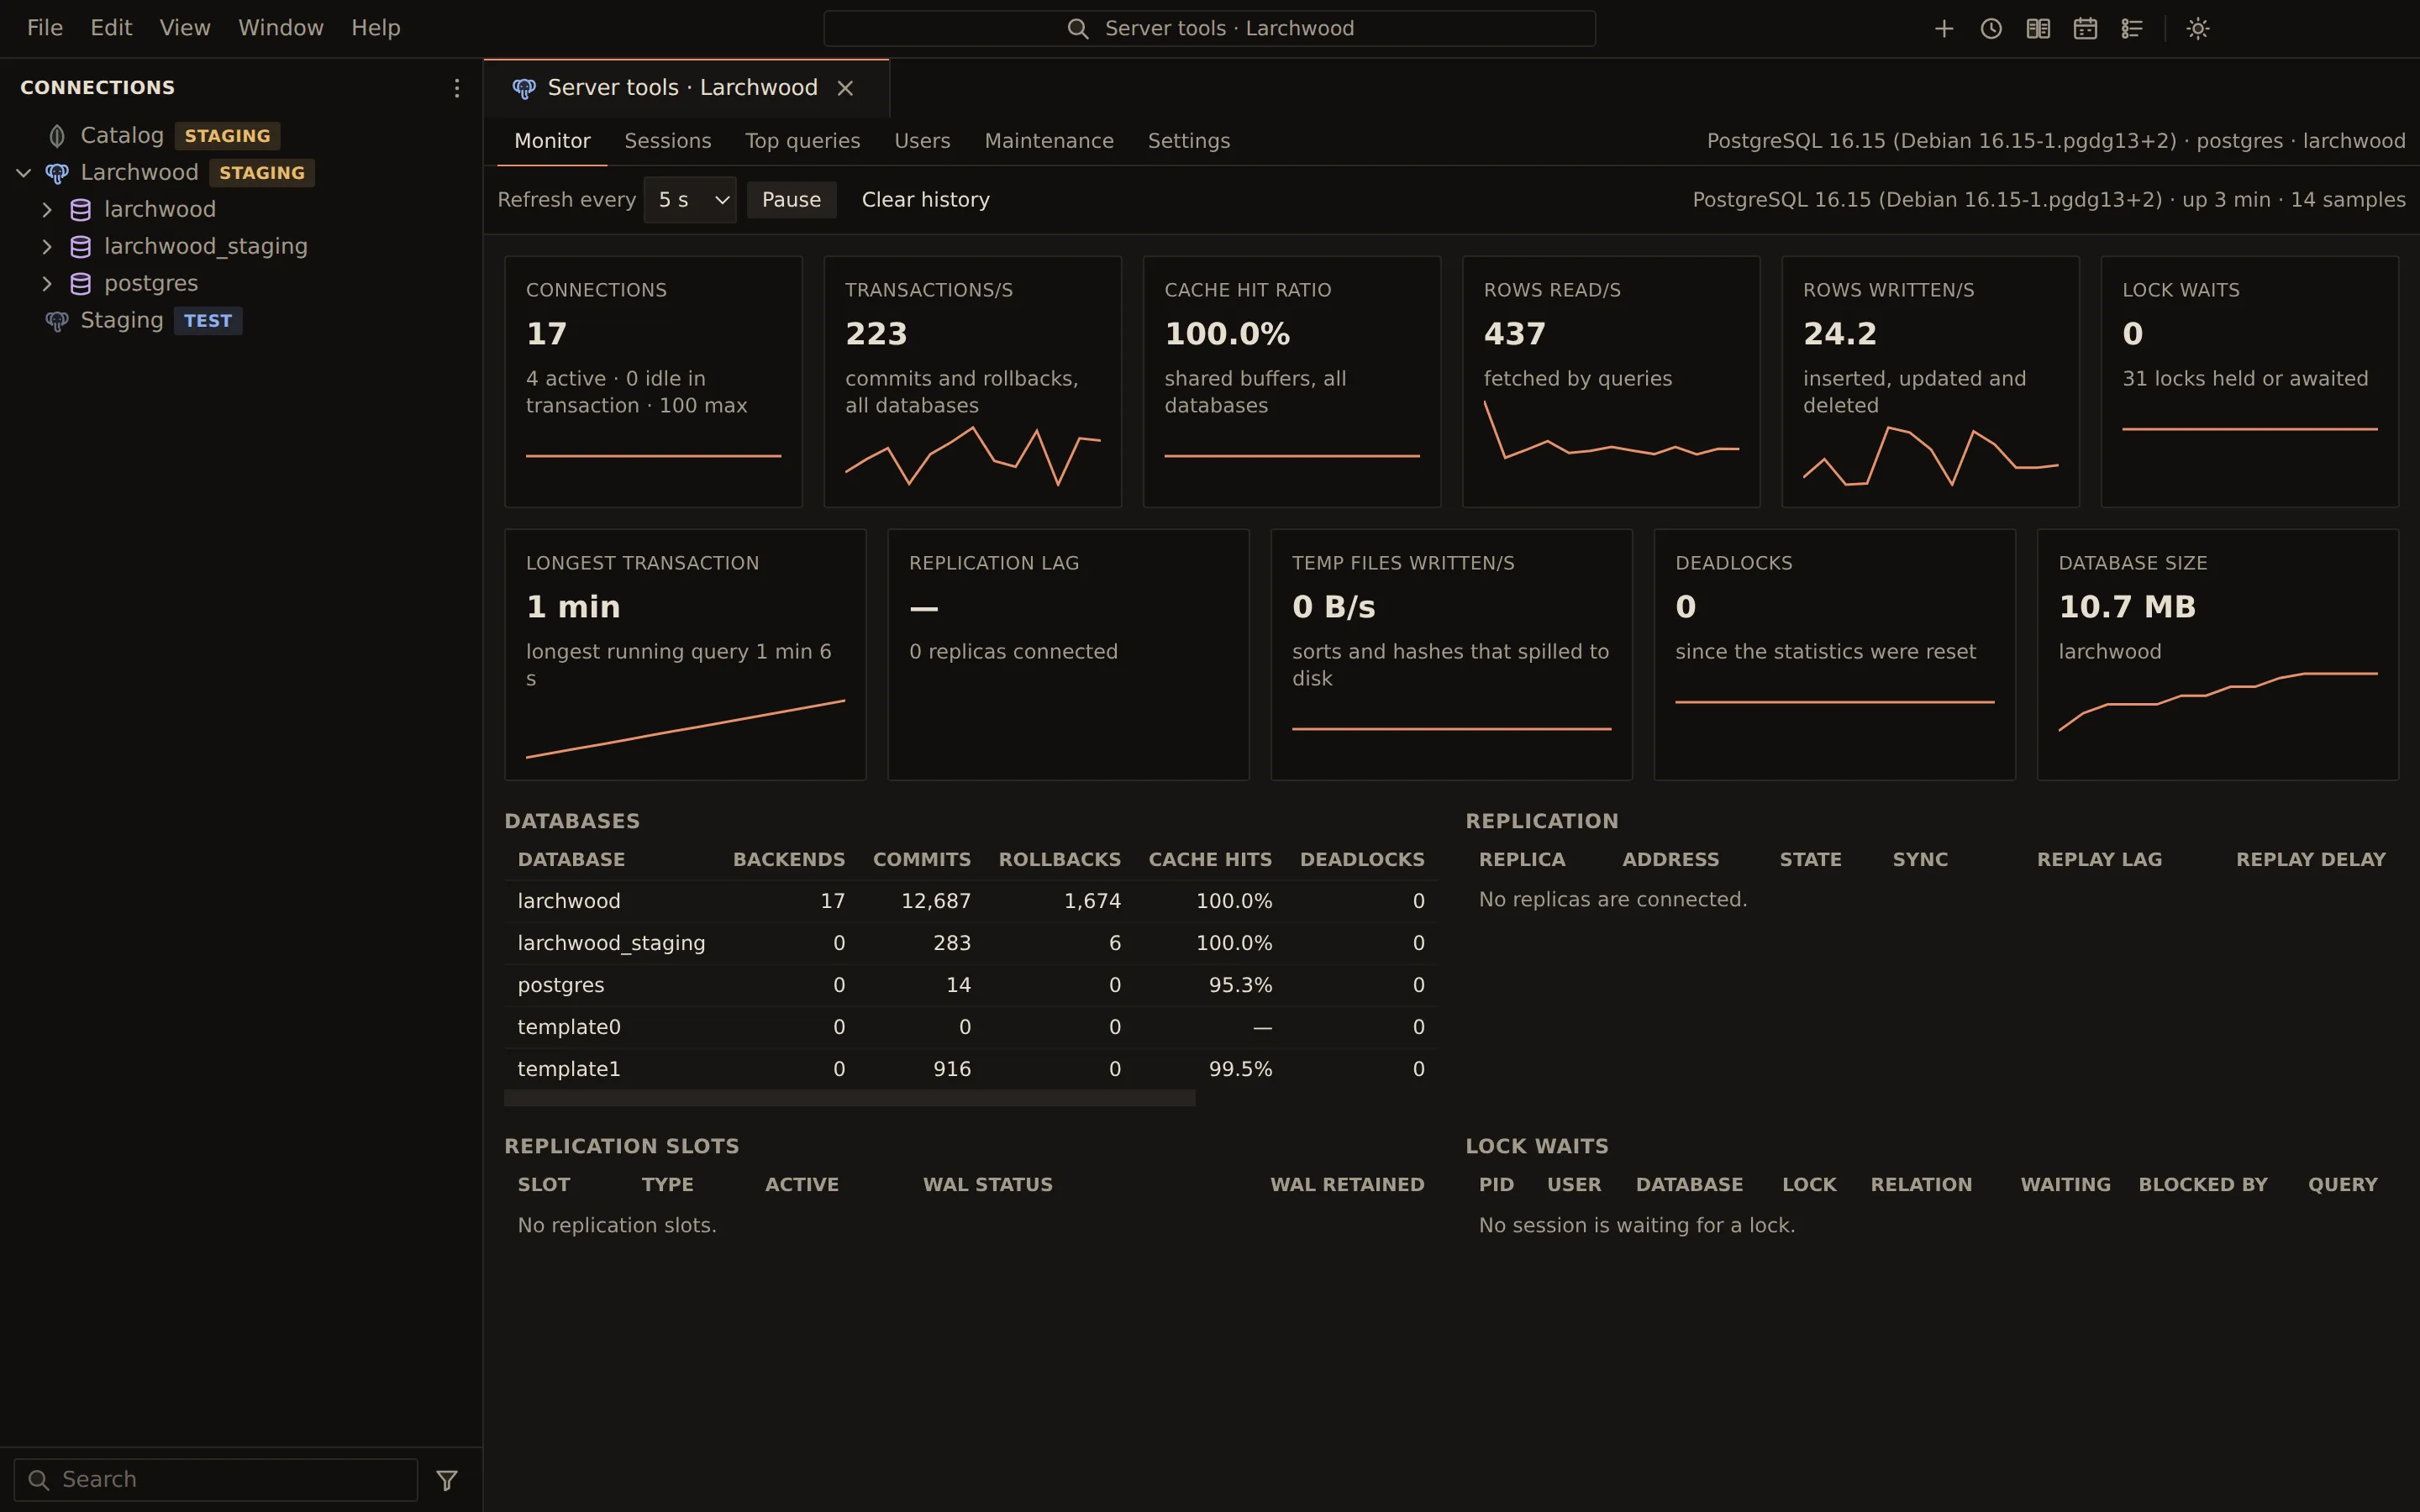
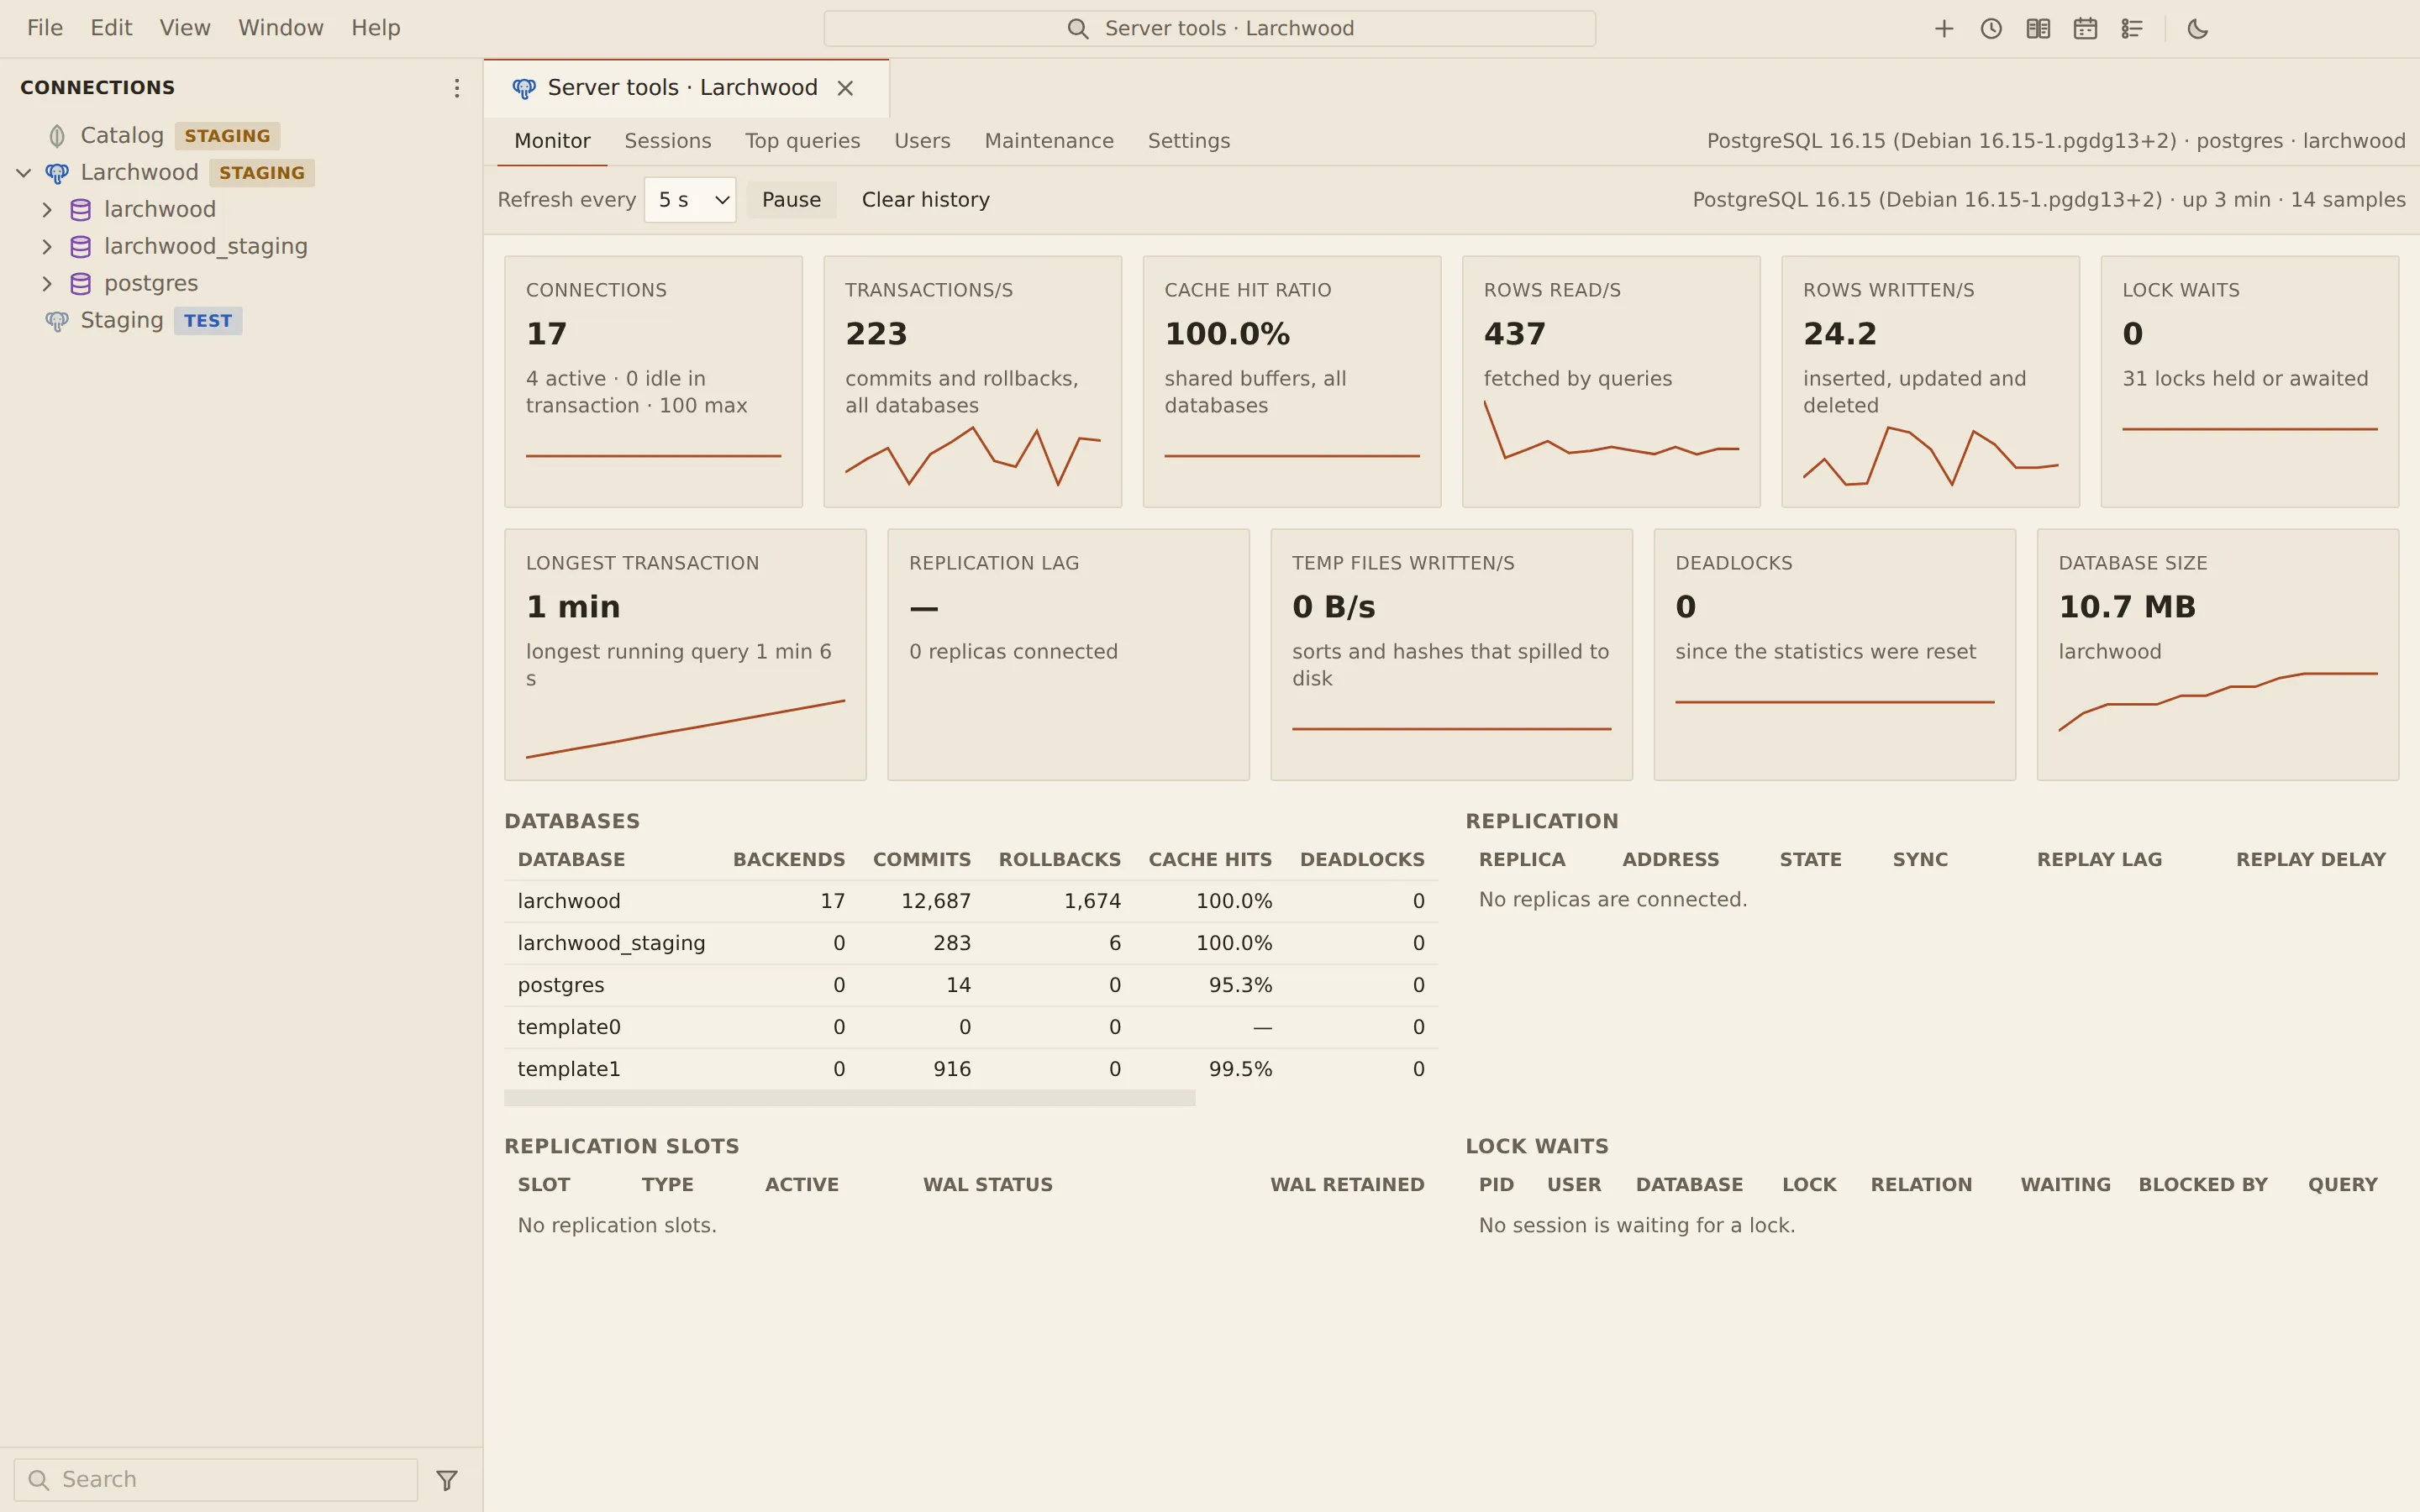
The monitor shows a server’s live figures as tiles with sparklines, and its tables (databases, replication, locks, the oplog) from the latest poll. It is the first tab of the server tools panel, which also holds sessions, top queries, users, maintenance and settings.
Open the monitor
Section titled “Open the monitor”- Connect, then right-click the connection in the sidebar (or use its … button) and choose Server tools.
- The Monitor tab opens and starts polling. Use the arrow keys to move between tabs.
The monitor keeps polling while another tab of the panel is showing, so the history has no gaps. The history is kept per connection for as long as the app runs.
Toolbar
Section titled “Toolbar”| Control | What it does |
|---|---|
| Refresh every | The poll interval: 1, 2, 5 (the default), 10, 30 or 60 seconds |
| Pause / Resume | Stops and restarts polling |
| Clear history | Empties the sparklines |
The right of the toolbar shows the server product and version, its uptime and the number of samples taken.
What each engine shows
Section titled “What each engine shows”Counters are turned into per-second rates, and counter pairs into a ratio over each interval.
| Engine | Tiles |
|---|---|
| PostgreSQL | Connections, Transactions/s, Cache hit ratio, Rows read/s, Rows written/s, Lock waits, Longest transaction, Replication lag or Replay delay, Temp files written/s, Deadlocks, Database size |
| MySQL and MariaDB | Queries/s, Threads connected, Threads running, Buffer pool hit ratio, Buffer pool used, Replica lag, Slow queries/s, Received/s, Sent/s, Row lock waits/s, Temp tables on disk/s, Failed connections/s |
| MongoDB | Connections, Operations/s, Read latency, Write latency, Cache hit ratio, Cache used, Queued operations, Network in/s, Network out/s, Resident memory, Replication lag, Oplog window |
Below the tiles, tables add detail: Databases, Replication, Replication slots and Lock waits on PostgreSQL; Statements, InnoDB and Replication on MySQL and MariaDB; Operations since start, Replica set and Oplog on MongoDB. On a PostgreSQL standby the replication tile shows Replay delay; on a primary it shows Replication lag across the connected replicas.
Related
Section titled “Related”Documents Querybara 0.1.1 · built frombc9f5aa